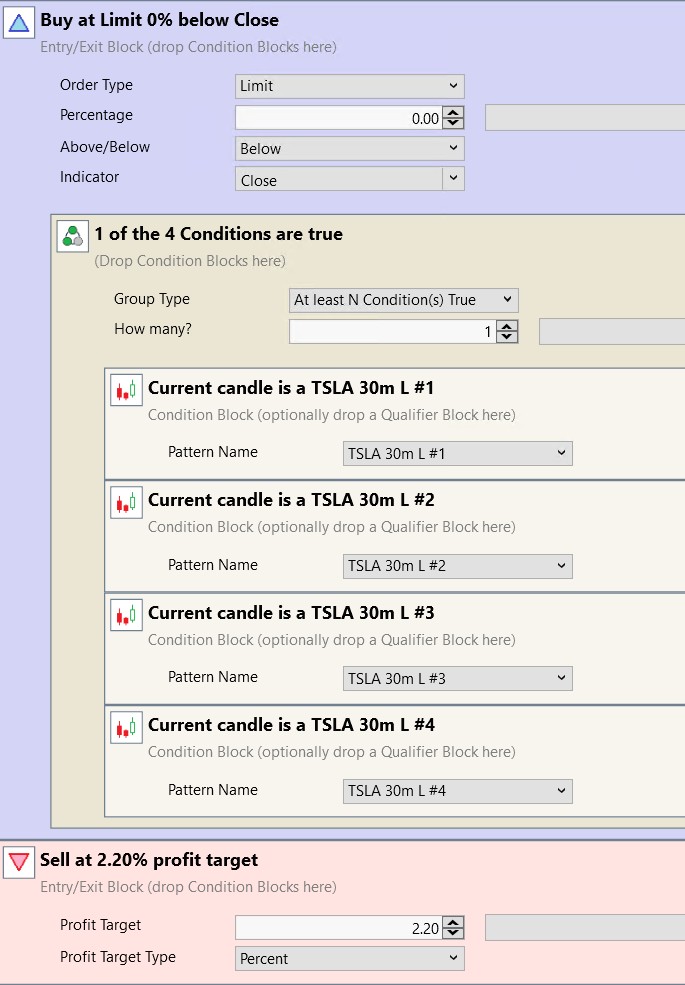
I have a strategy based on candlestick patterns. It has very strange behavior:
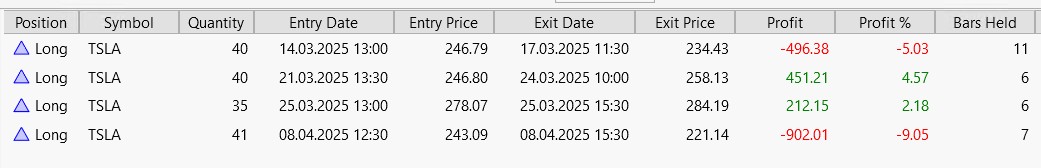
first picture - backtest for the last 2 months
second picture - for the last 2 weeks
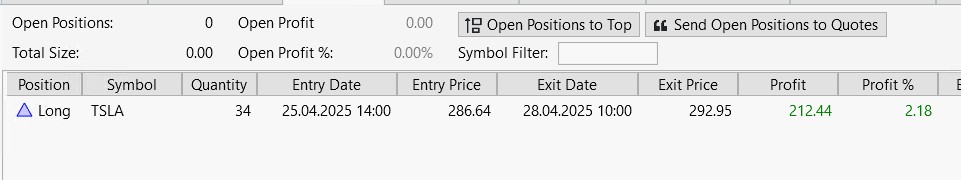
As you can see, the trade of 25.04 is absent on the first one.
At the same time, yesterday there was a strategy entry via strategy monitor. It is not on any backtest at all.
first picture - backtest for the last 2 months
second picture - for the last 2 weeks
As you can see, the trade of 25.04 is absent on the first one.
At the same time, yesterday there was a strategy entry via strategy monitor. It is not on any backtest at all.
Rename
It's likely an edge case. Chart pattern conditions are dependent on ATR (ATRPercent), which is an IIR-type indicator that needs a lot of seed bars to stabilize. If using the 10-period default setting (Preferences > Chart Patterns), you need at least 30 or 40 bars before you get a stable value.
See F1 > Help > Indicators > Stability of Indicators
My guess is that the trade would disappear if you just added 1 or 2 more weeks.
See F1 > Help > Indicators > Stability of Indicators
My guess is that the trade would disappear if you just added 1 or 2 more weeks.
>My guess is that the trade would disappear if you just added 1 or 2 more weeks.
Right
What about the fact that there was a trade in strategy monitor, but at no point do I see it on the backtest? SM uses also 2 weeks as on the second picture
Right
What about the fact that there was a trade in strategy monitor, but at no point do I see it on the backtest? SM uses also 2 weeks as on the second picture
Already explained. You may (or may not) see the trade with only a little seed data - it's unstable. Next Monday it may change again because the ATR values are not stabilized. Load 4 weeks for these strategies in the S. Monitor.
Another note is that your strategy doesn't actually use any indicators, so there isn't really even a "StartIndex" period. To fix that, add another condition that uses a SMA with a period of 13 bars x 10 days (2 weeks) = 130 or more. For example, SMA(Close, 150) > 5000000 will probably never be true. That will add a StartIndex = 150 so that your strategy will ignore the first 150 bars of data. Make sure to load sufficient data, like 4 weeks.
Another note is that your strategy doesn't actually use any indicators, so there isn't really even a "StartIndex" period. To fix that, add another condition that uses a SMA with a period of 13 bars x 10 days (2 weeks) = 130 or more. For example, SMA(Close, 150) > 5000000 will probably never be true. That will add a StartIndex = 150 so that your strategy will ignore the first 150 bars of data. Make sure to load sufficient data, like 4 weeks.
Can candlestick patterns work incorrectly due to streaming bars?
Today, the situation repeated itself, even though I rewrote the strategy in C#, added StartIndex, and increased the period to six months, which is more than enough.
Yesterday, the strategy sent an order after the market closed, and today it was executed at the opening. I was watching at that moment, SL and TP signals were generated in SM, and there are also signals in the log. Then I tried to repeat it on the backtest, but there is no trace of yesterday's order or today's trade.
Then, as a test I changed the quotes to alpaca and the backtest turned out completely different. The 30-minute bars are not that different, in my opinion.
Yes, bars built using streaming data might not match subsequently downloaded historical bars. It’s a matter of whether the streaming provider uses conflation or sends through certain ticks that’s their process for generating historical bars might not. In my experience IQFeed is the must reliable streaming source.
Free Alpaca data is IEX only - not suitable for live system trading.
See: All About WealthLab Intraday and Realtime Data Providers
See: All About WealthLab Intraday and Realtime Data Providers
There's definitely a bug here. I've noticed this several times: in the Strategy Monitor the strategy issues a signal and I can see in both the log and at the broker that a position was opened then the stops were placed correctly. But when I run a backtest on the exact same data afterward that trade just isn't there.
The settings are identical in both cases and I'm running it on polling data over the last six months which should be more than enough. I am writing purely for information because I doubt this kind of bug is even possible to track down so I'll probably just disable this strategy on my end
The settings are identical in both cases and I'm running it on polling data over the last six months which should be more than enough. I am writing purely for information because I doubt this kind of bug is even possible to track down so I'll probably just disable this strategy on my end
If you enabled Use Live Positions in Preferences > Trading, we definitely expect to see a difference, depending on all the information in the Help doc about this option.
If that's not it, there's definitely a difference to find. The same Backtester is used for all backtests.
If that's not it, there's definitely a difference to find. The same Backtester is used for all backtests.
I don't use Live Positions. I was able to get the trade to show up in the backtest after I disabled the Pre/Post Market Data Filter in the backtest, even though I always have this checkbox enabled in Strategy Monitor and in all backtests.
Thus it turns out that the Pre/Post Market Data Filter did not work in SM in this case.
I can try adding a check to see if data outside the regular trading session is visible in the SM strategy itself even with checkbox enabled to confirm this assumption but that will be next week.
Update: I just checked it on a stopped market and the data is filtered correctly. I suspect the CandleGeneDecoder class itself receives all the data without filtering meaning this only applies to it. Or maybe it's a random bug. Anyway when mining these patterns there is no way to change Filter mode so I assume it's always on
Thanks for the info. You could be on to something, but Strategies pass the BarHistory bars to DetectPattern() like this:
CODE:Anyway, anything's possible. If you can make a specific example (date range, pattern, symbol, and a copy of your Preferences > Candlesticks > Tuning Parameters) it would help to pinpoint the issue.
if (CandleGeneDecoder.DetectPattern(bars, idx, "Neutral Doji"))
Your Response
Post
Edit Post
Login is required