When I use the SPY as a benchmark symbol for a simple daily strategy, the SPY's annual returns for 2025 are incorrect in the performance table for monthly returns.
APR SPY 2025 = 3.77% (??)
I searched for the ticker symbol SPY in my system folder and deleted it, but that didn't change anything.
Does anyone else have this problem? Bug?
APR SPY 2025 = 3.77% (??)
I searched for the ticker symbol SPY in my system folder and deleted it, but that didn't change anything.
Does anyone else have this problem? Bug?
Rename
Without the details for the actual test, this info may explain it:
The benchmark buy & hold starts on the StartIndex, which is when the indicators become valid and the strategy can start trading. If using a 200-bar moving average and testing for 2025, the benchmark buy & trade would have started with the opening trade on (or around) 22-Oct-2025 and ended with the close on 31-Dec. That one would be a 1.46% gain and about 7.8% APR.
The benchmark buy & hold starts on the StartIndex, which is when the indicators become valid and the strategy can start trading. If using a 200-bar moving average and testing for 2025, the benchmark buy & trade would have started with the opening trade on (or around) 22-Oct-2025 and ended with the close on 31-Dec. That one would be a 1.46% gain and about 7.8% APR.
HI Cone!
I backtested a strategy that I have had stored on my computer for years. Suddenly, the benchmark is no longer correct. And not just for this one strategy, but for all the strategies I test. Other benchmark symbols such as QQQ also show incorrect comparative values for the year 2025. Example 1 with SPY as the benchmark, example 2 with QQQ. I am Using WL Build 152
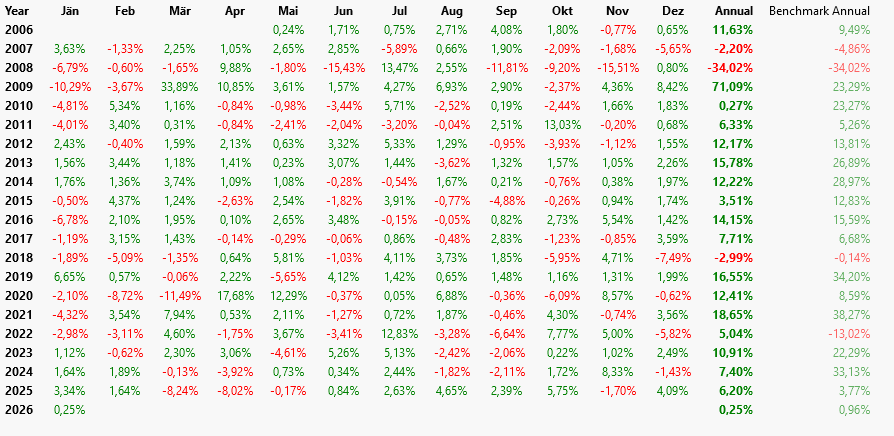
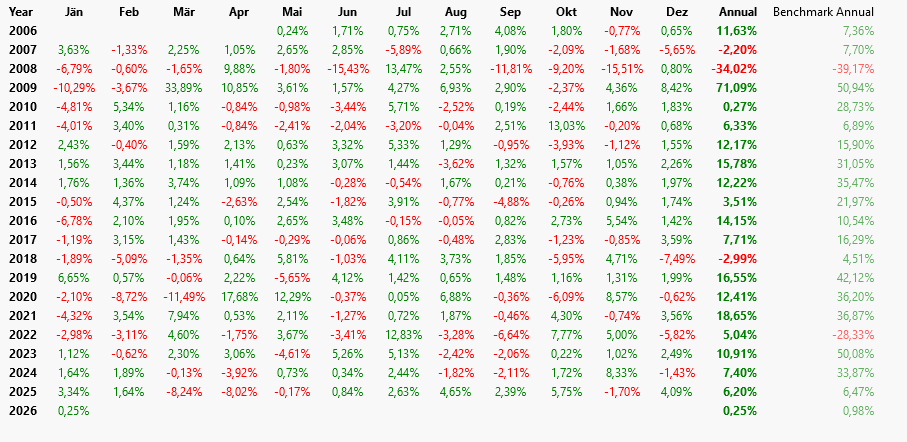
I backtested a strategy that I have had stored on my computer for years. Suddenly, the benchmark is no longer correct. And not just for this one strategy, but for all the strategies I test. Other benchmark symbols such as QQQ also show incorrect comparative values for the year 2025. Example 1 with SPY as the benchmark, example 2 with QQQ. I am Using WL Build 152
Thanks for the image. Now I see we're talking about something different entirely.
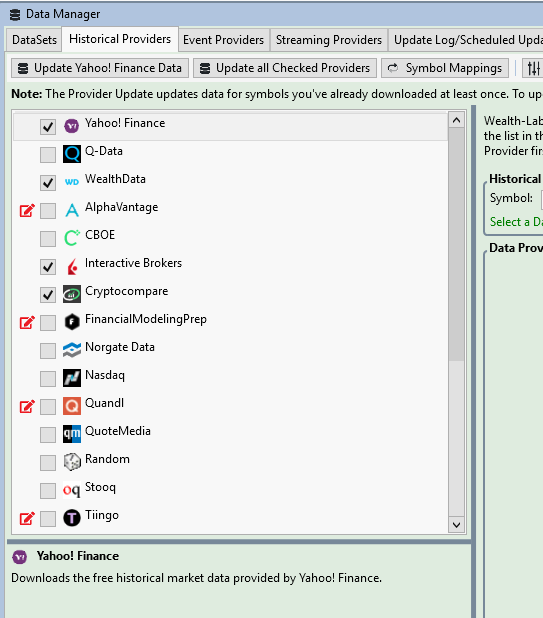
Which Historical Provider do you have checked at the top of the list in the Data Manager? It would be good to see a chart on your machine for 2025 from that provider.
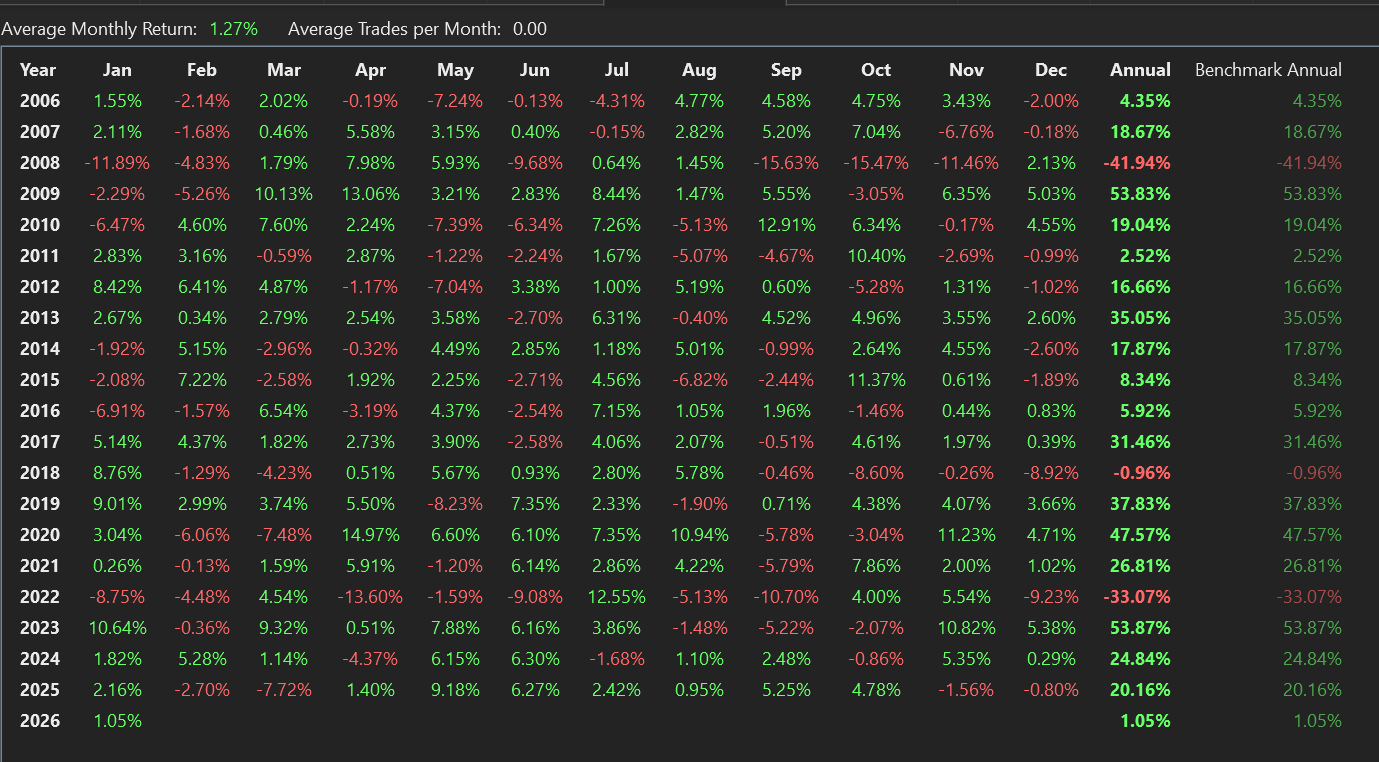
Here's the result of a Buy & Hold backtest of Wealth-Data QQQ with QQQ also as the benchmark. (Dividends not applied.)
Which Historical Provider do you have checked at the top of the list in the Data Manager? It would be good to see a chart on your machine for 2025 from that provider.
Here's the result of a Buy & Hold backtest of Wealth-Data QQQ with QQQ also as the benchmark. (Dividends not applied.)
Yahoo. But when I disable Yahoo, the results don't change.
Quite a mystery. Try this for a test:
Preferences > Backtest > Other Settings > Futures Mode ... if checked, uncheck it, and run your backtest again to see if anything changed.
Preferences > Backtest > Other Settings > Futures Mode ... if checked, uncheck it, and run your backtest again to see if anything changed.
Thanks. Will come back to this on monday.
Preferences > Backtest > Other Settings > Futures Mode
Done - check/uncheck - nothing changes...
This setting was unchecked all the time!
I am also using WL on a second pc (server).
There are also wrong monthly return results with benchmarks like syp, qqq etc. Two machine - same bad results...
On Server: WL Build 132 - I deliberately did not do an update.
Local PC: WL Build 152
Any Ideas please that could help, Cone?
I think you should write support at info@wealth-lab.com with a reference to this url.
Email sent! Thanks Cone!
I want thank KarlD77 for allowing me to revisit and explain the setting that caused this perceived anomaly. In a nutshell, Karl was performing a Multi-Currency backtest in EUR. This is in the Backtest Settings:

The main thing to understand is that with this simple switch, you've just converted the entire backtest into Euro terms. Copied the (F1) Help for that setting:
Enabling Multi-Currency has the following effect on backtests:
1. Starting Equity is specified the base currency.
2. Backtest Equity and Cash update in the specified base currency.
3. Trade profit, commissions and dividends are converted to the base currency when applied to the backtest.
4. Positions are sized in the trade currency (non-base), but with respect to the account's equity in the base currency (see example).
5. Trade Profit reported in the Positions Visualizer is shown in the trade's non-base currency, however, the column Fx Gain (Base) provides the amount that the Position gained/lost in the base currency due to the effect of the currency exchange.
6. In Futures Mode, WealthLab converts futures margin to the base currency to reduce Cash available. This base value is returned to Cash and Equity curves when exiting the trade, so no gain will be associated with the currency effect. However, the gain applied to the equity curve is the trade gain/loss in the trade currency converted to the base currency at the exchange rate each day.
Here's the effect on a 2-year Buy & Hold (QQQ) backtest starting on 1/1/2024, comparing the difference between USD and a EUR backtest.
First, the position size changes. Since EURUSD was 1.0939 on the signal date, here's how the shares are calculated:

Here's an edit of a copy of the equity curves from each backtest - USD and EUR - around the end of the year, and with a Annual % calculation.

The next thing to verify is if WL is calculating the Equity correctly for both backtests based on the Exchange rate.
 The USD backtest equity is simply the shares x price + cash (all in USD). You can see that the calculated value on the right matches the equity curve value in USD exactly.
The EUR backtest equity is shares x price / exchange rate + cash, giving a value in Euros. There was a small difference (right-most column) that I can't reconcile at the moment (it could just be a precision issue), but in general it appears that the calculation is correct.
Finally, note the Fx Gain (EUR) in last row of the spreadsheet for the position (EUR). It indicates that holding this position in USD, we lost -6,294.63 Euros due to the currency effect of Euro rising from 1.0939 to 1.1879. In other words, since we exchanged 50,000 EUR for USD to buy QQQ, the final value of the trade was 6,294.63 less than it would have been had the exchange rate not moved from 1.0939.
Voila! Mystery solved.
The main thing to understand is that with this simple switch, you've just converted the entire backtest into Euro terms. Copied the (F1) Help for that setting:
Enabling Multi-Currency has the following effect on backtests:
1. Starting Equity is specified the base currency.
2. Backtest Equity and Cash update in the specified base currency.
3. Trade profit, commissions and dividends are converted to the base currency when applied to the backtest.
4. Positions are sized in the trade currency (non-base), but with respect to the account's equity in the base currency (see example).
5. Trade Profit reported in the Positions Visualizer is shown in the trade's non-base currency, however, the column Fx Gain (Base) provides the amount that the Position gained/lost in the base currency due to the effect of the currency exchange.
6. In Futures Mode, WealthLab converts futures margin to the base currency to reduce Cash available. This base value is returned to Cash and Equity curves when exiting the trade, so no gain will be associated with the currency effect. However, the gain applied to the equity curve is the trade gain/loss in the trade currency converted to the base currency at the exchange rate each day.
Here's the effect on a 2-year Buy & Hold (QQQ) backtest starting on 1/1/2024, comparing the difference between USD and a EUR backtest.
First, the position size changes. Since EURUSD was 1.0939 on the signal date, here's how the shares are calculated:
Here's an edit of a copy of the equity curves from each backtest - USD and EUR - around the end of the year, and with a Annual % calculation.
The next thing to verify is if WL is calculating the Equity correctly for both backtests based on the Exchange rate.
The USD backtest equity is simply the shares x price + cash (all in USD). You can see that the calculated value on the right matches the equity curve value in USD exactly.The EUR backtest equity is shares x price / exchange rate + cash, giving a value in Euros. There was a small difference (right-most column) that I can't reconcile at the moment (it could just be a precision issue), but in general it appears that the calculation is correct.
Finally, note the Fx Gain (EUR) in last row of the spreadsheet for the position (EUR). It indicates that holding this position in USD, we lost -6,294.63 Euros due to the currency effect of Euro rising from 1.0939 to 1.1879. In other words, since we exchanged 50,000 EUR for USD to buy QQQ, the final value of the trade was 6,294.63 less than it would have been had the exchange rate not moved from 1.0939.
Voila! Mystery solved.
Your Response
Post
Edit Post
Login is required