Hi,
There's a video on Youtube called "MFI Strategy Webinar" that shows a MFI strategy that generates 2M i profits. I can't replicate those results. Am I missing anything?
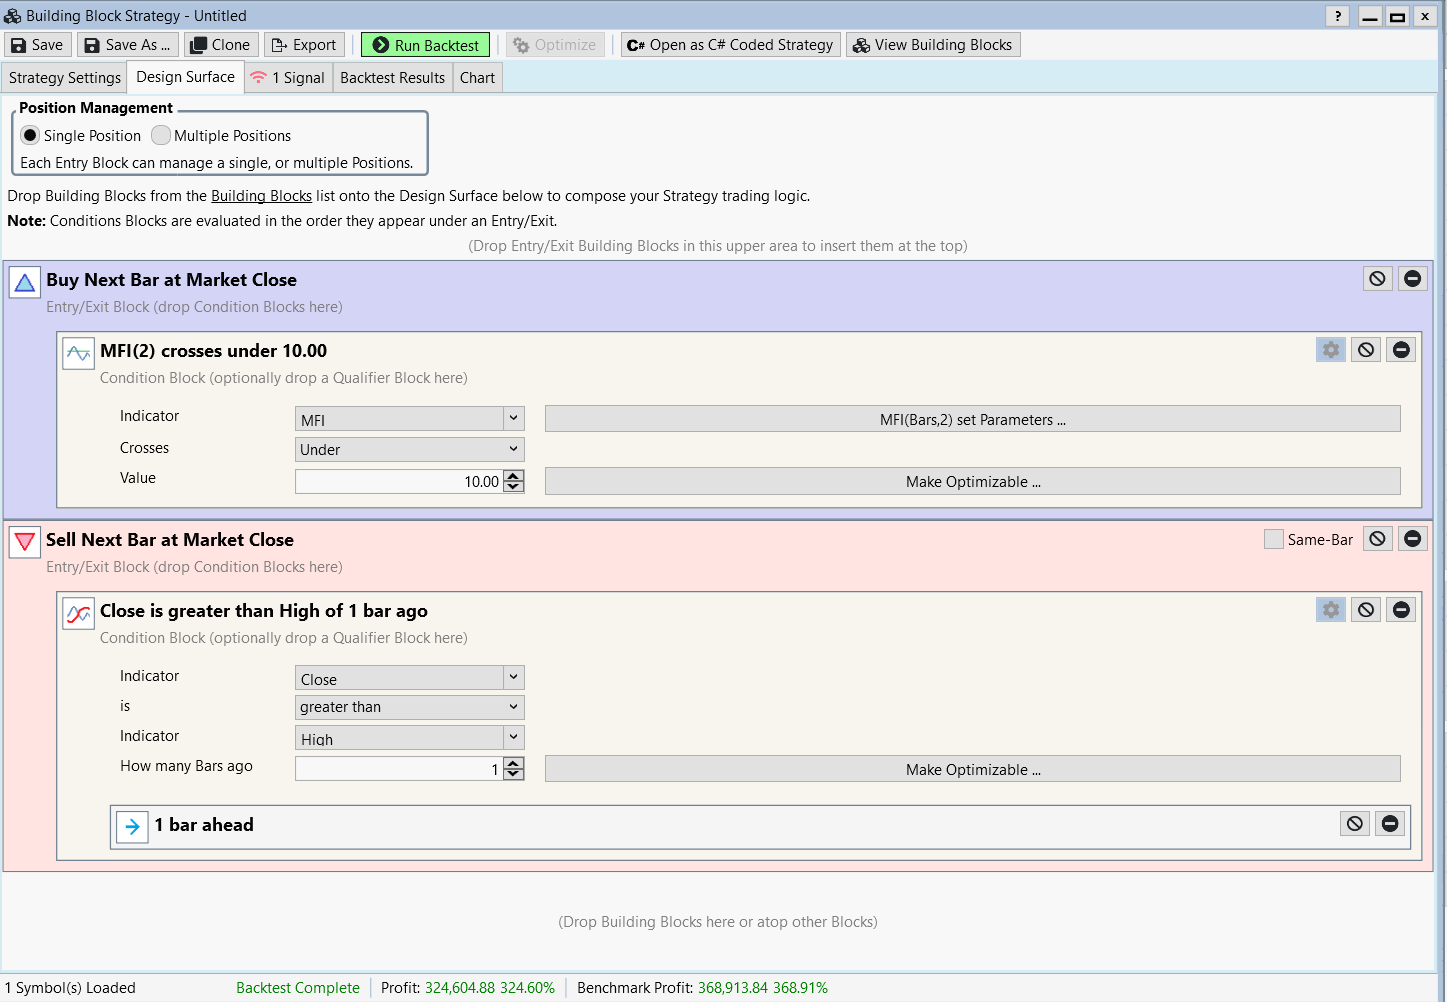

There's a video on Youtube called "MFI Strategy Webinar" that shows a MFI strategy that generates 2M i profits. I can't replicate those results. Am I missing anything?
Rename
Hi, can you please paste your Performance Metrics result here too. I will check my video and compare.
VK
VK
The first thing I realize is that you stated in 2000 and I in 1993. The compound interest effect can significantly increase your wealth over time. Somethin I also realized is that if I put the margin factor to 1.0 it reduces the profit. Less trades, less profits.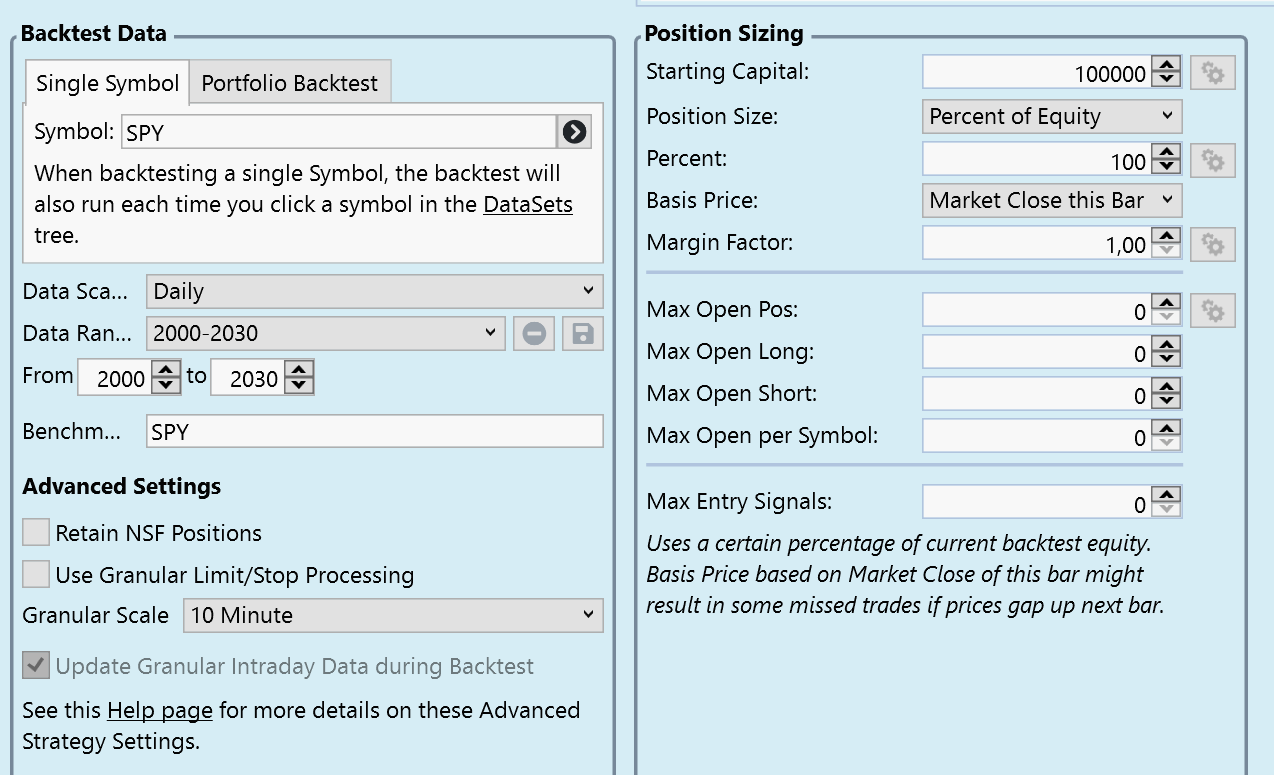
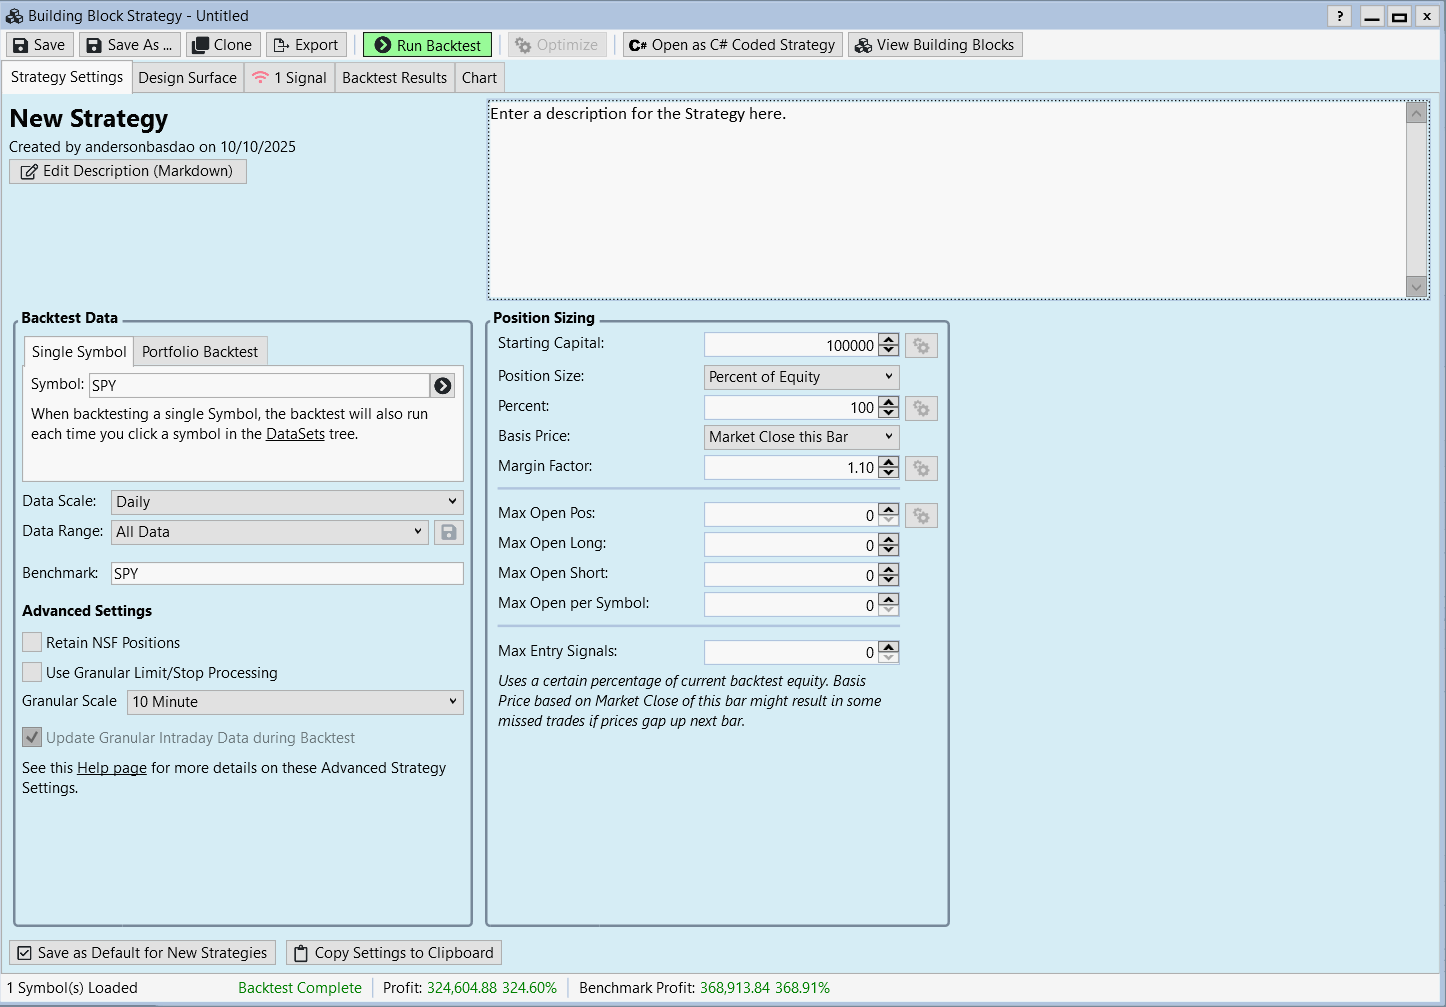
I used All Data and Margin 1.10 as shown in the video.

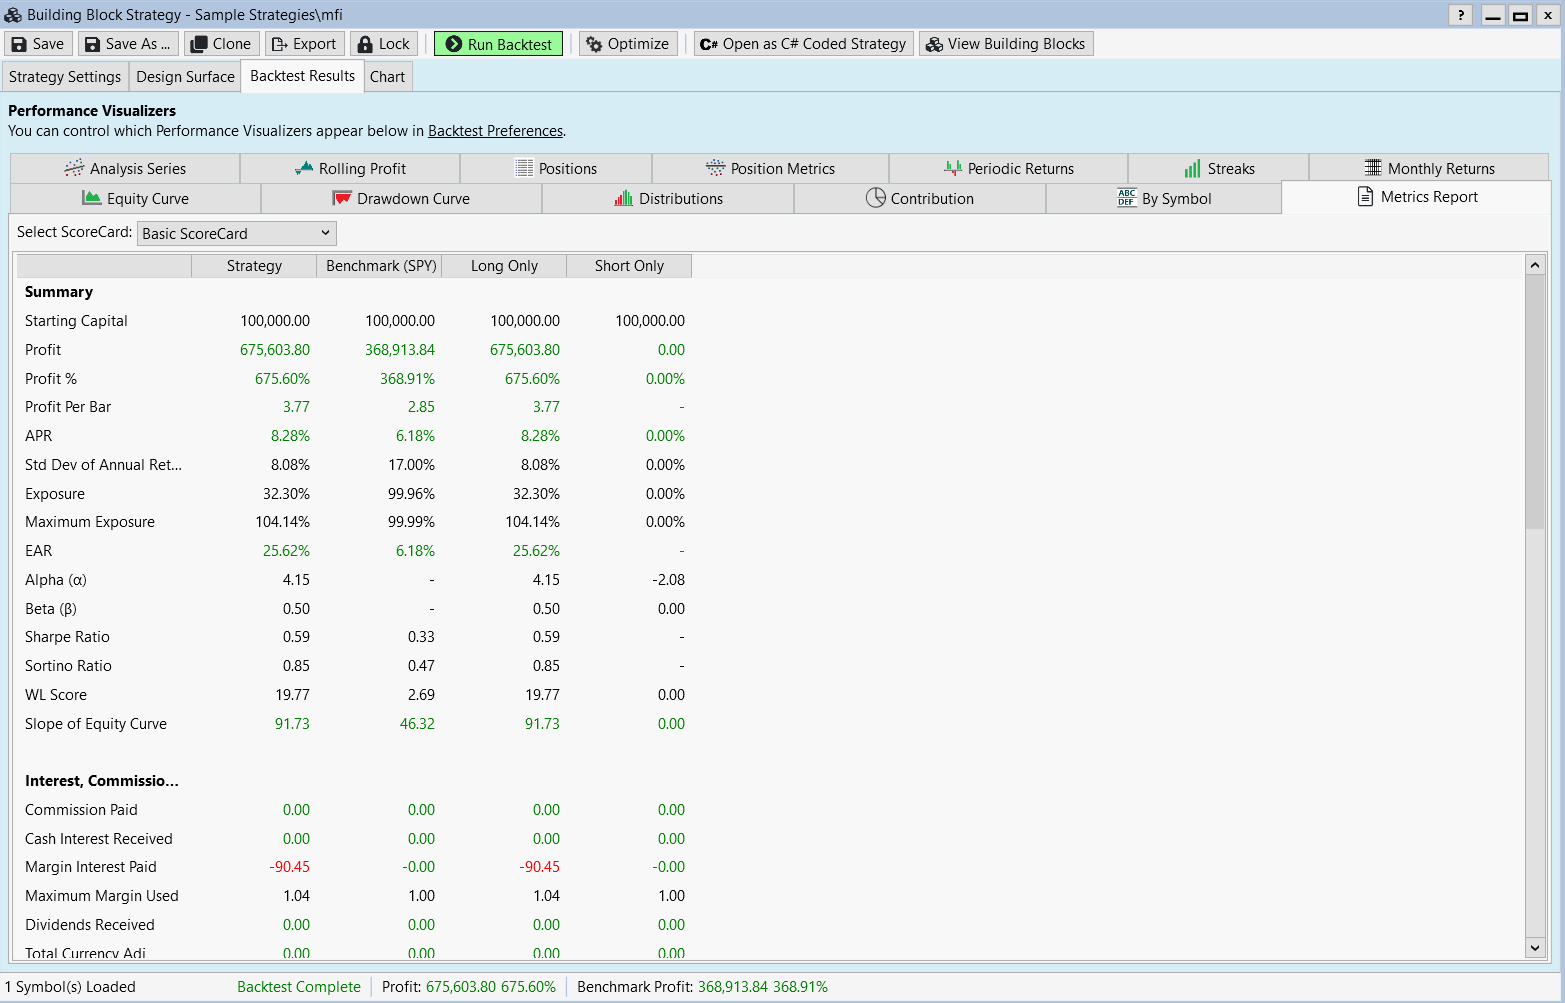
See, you miss 7 years of data, since my test in the YouTube video started at 1993. I posted it above. Can you please check and see if it matches then?
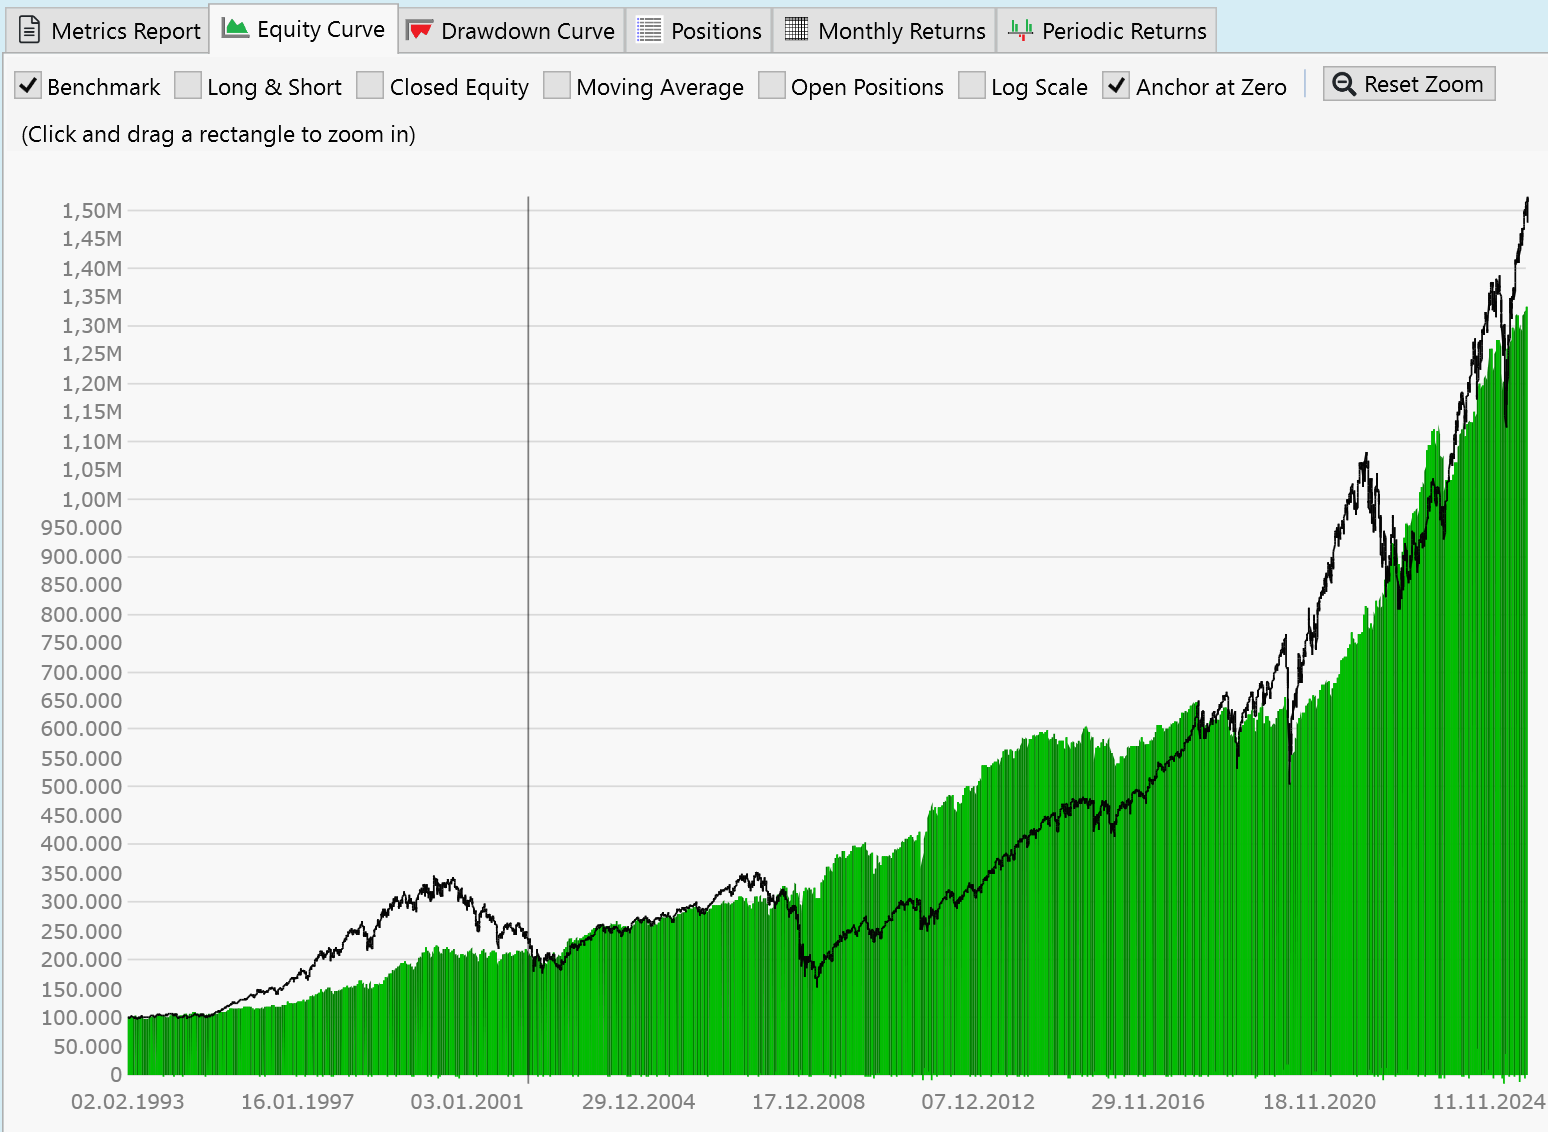
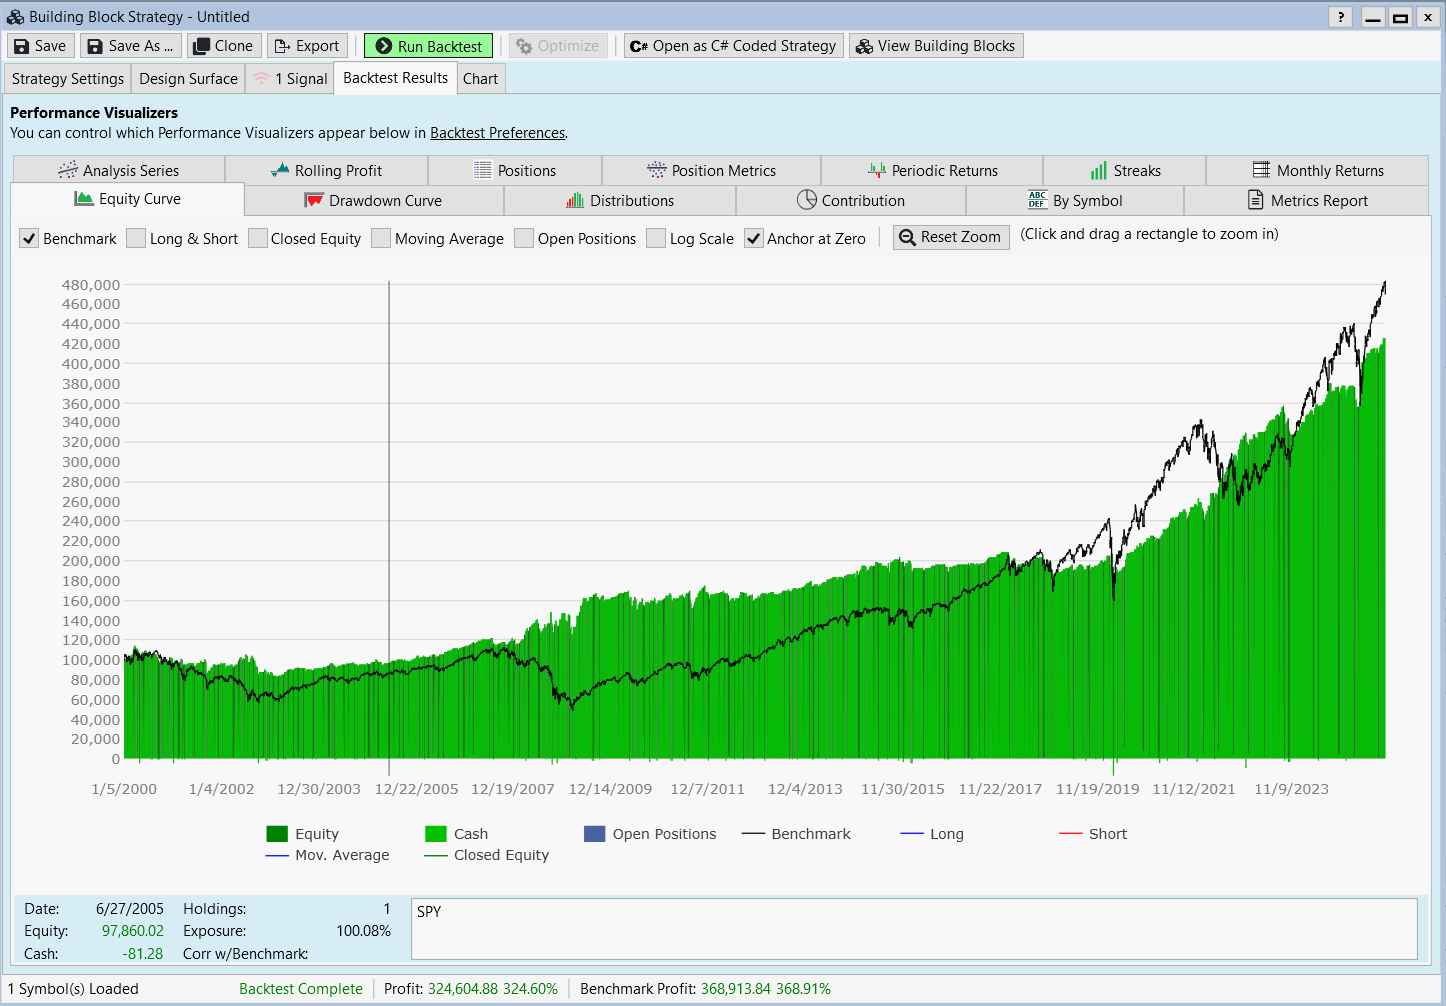
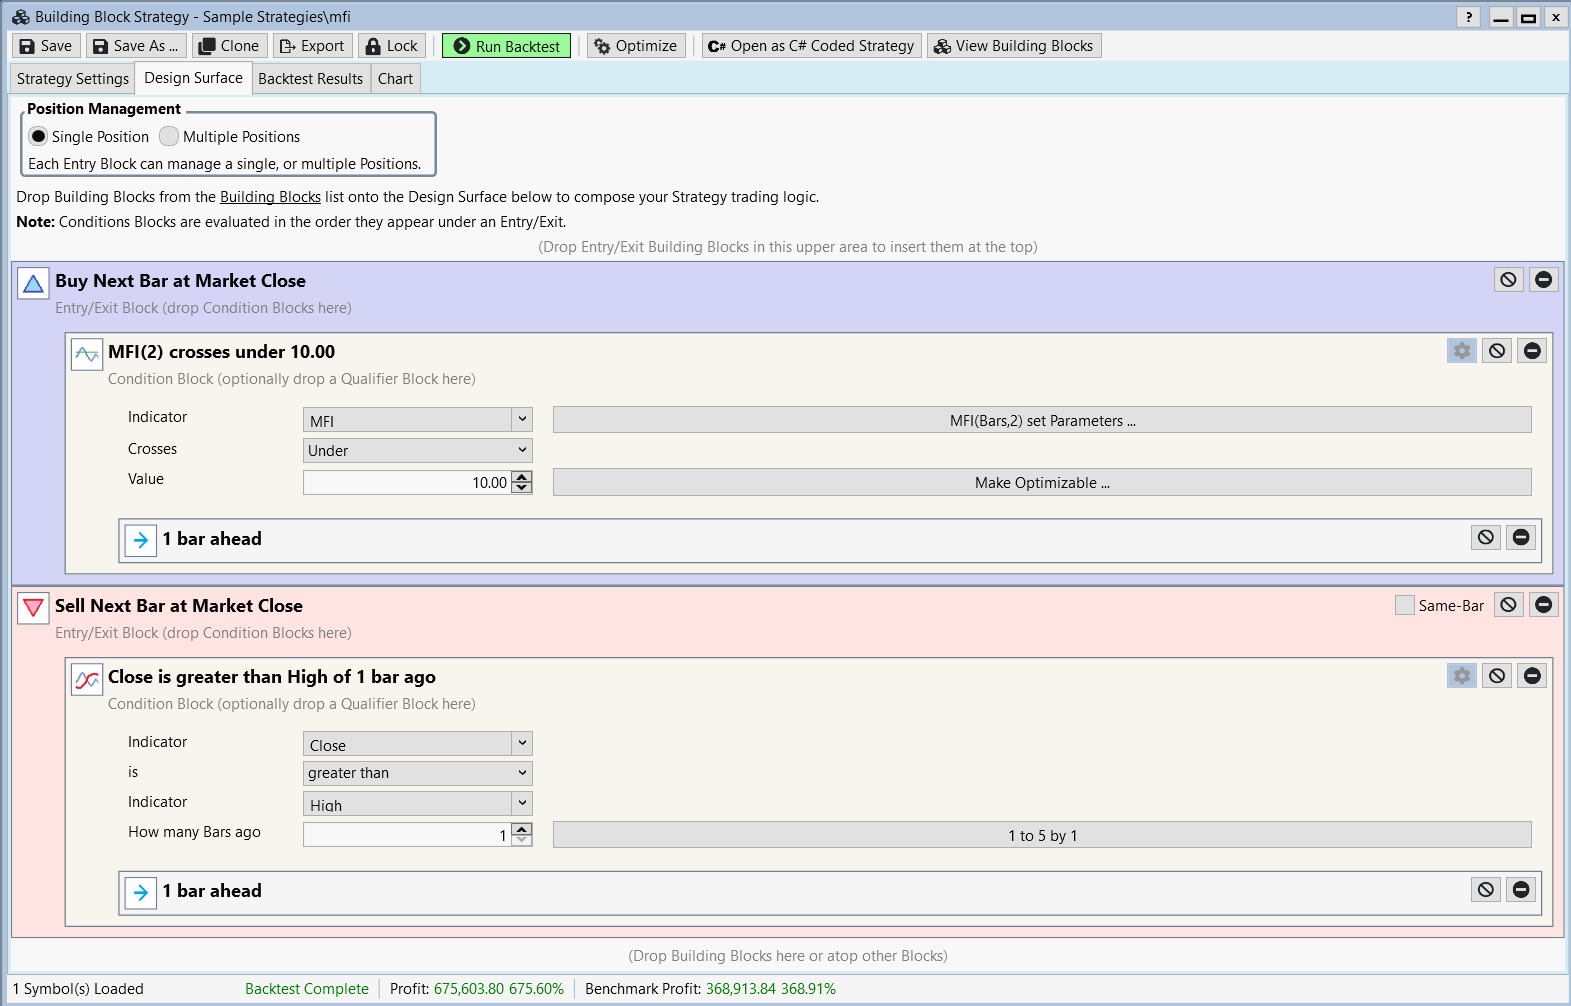
From the two equity curve screenshots I noticed that in the first screenshot by anderson the DD started in 2000 was conquered sometime in 2005. In the second screenshot by vk, a new ATH was reached in sometime in 2003 or early 2004. Given that this strategy only holds positions a few days on average, what could be the reason behind this difference?
It could be they used different commission and/or dividend collection preferences.
Even a different data source could be the reason. I try not use dividend, interest and commission when backtesting. I like to see the raw profit of the strategy.
I use WealthData. I don't have any special data package. It seems it only goes back to 2000.
What do you use, or should I use for my backtests in general?
What do you use, or should I use for my backtests in general?
I usually use WealthData, the SPY goes back to 1993.
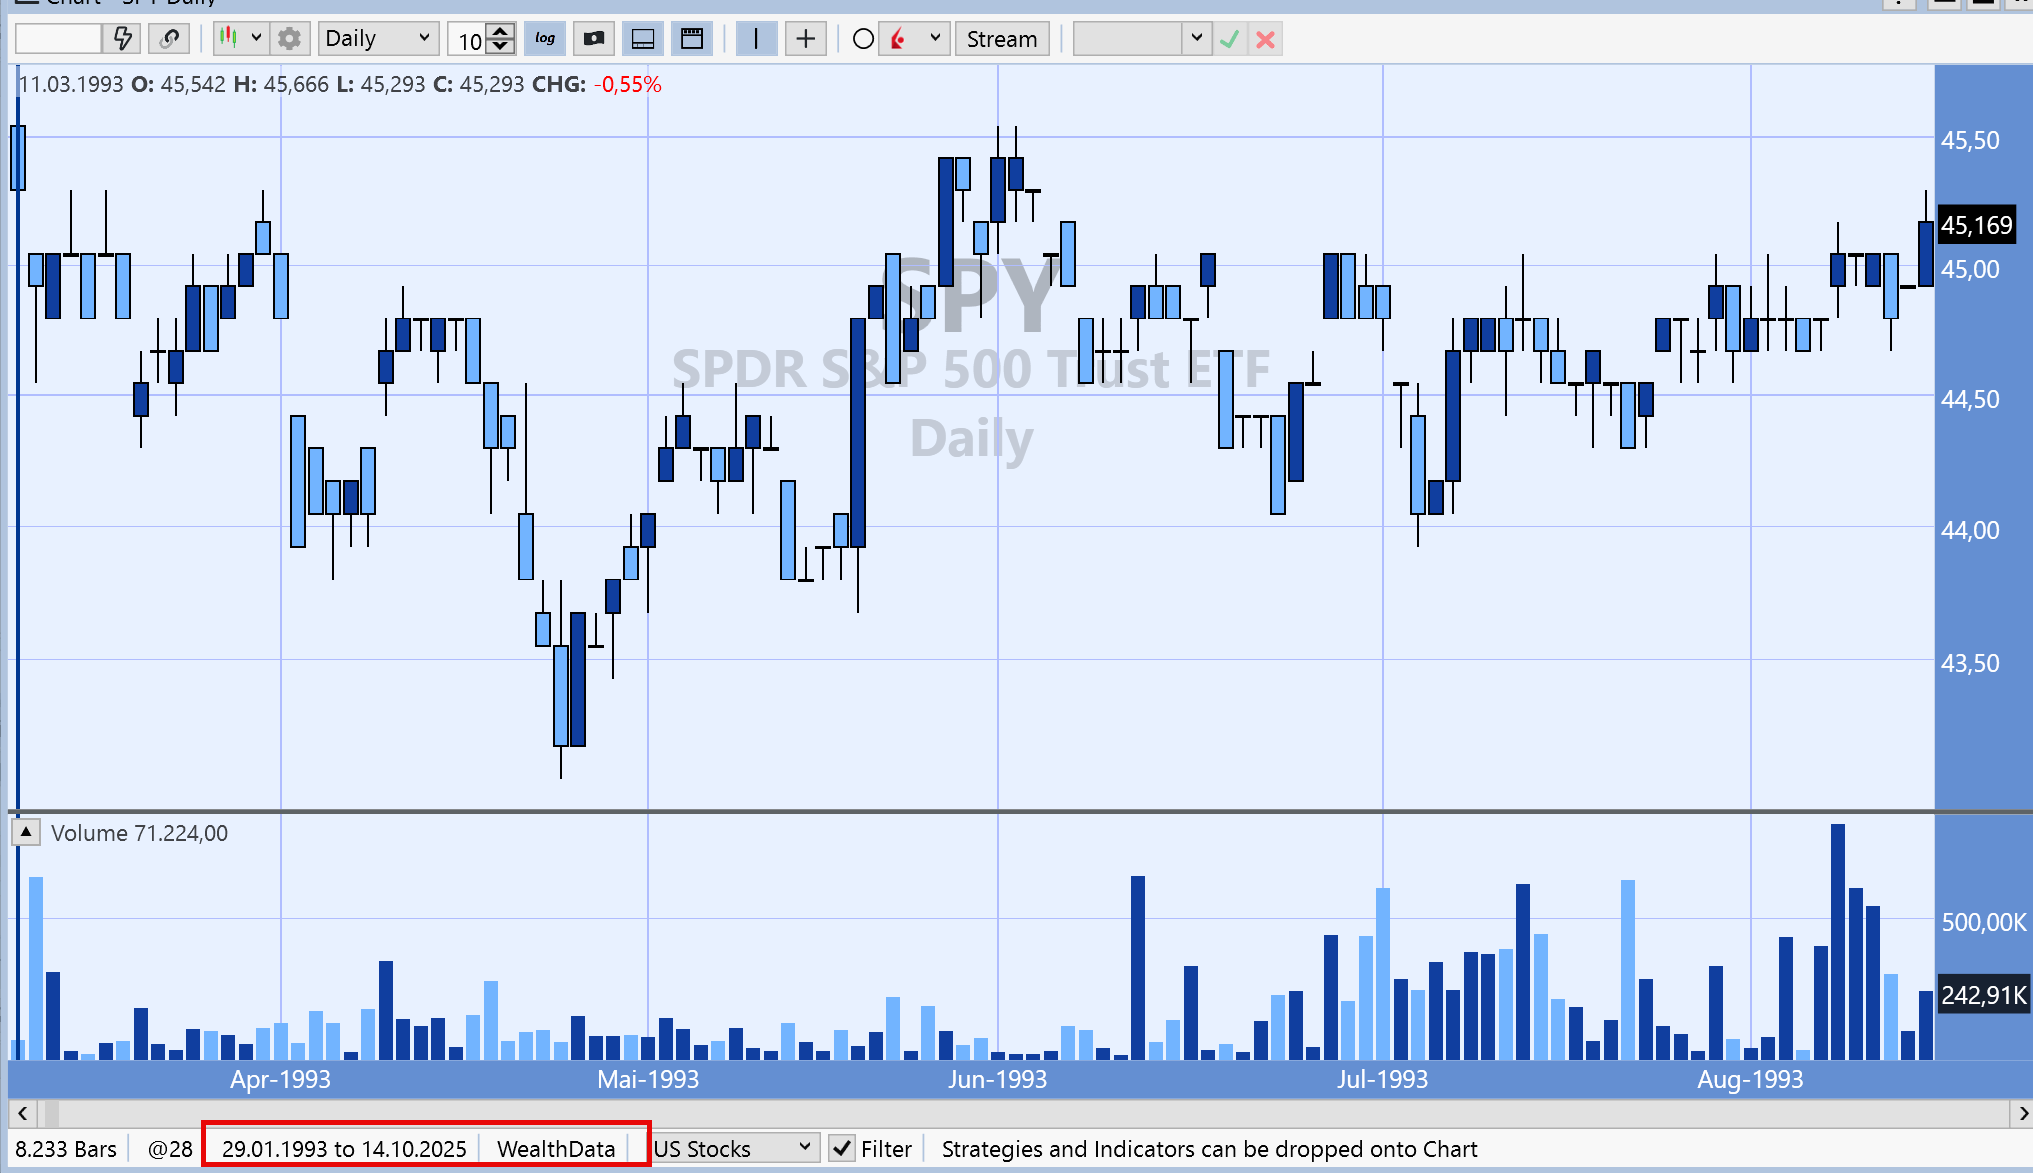
With the overhaul of the WealthData back end WealthData currently does only go back to 2000. VK has cached data for SPY that he accumulated before the transition.
Your Response
Post
Edit Post
Login is required