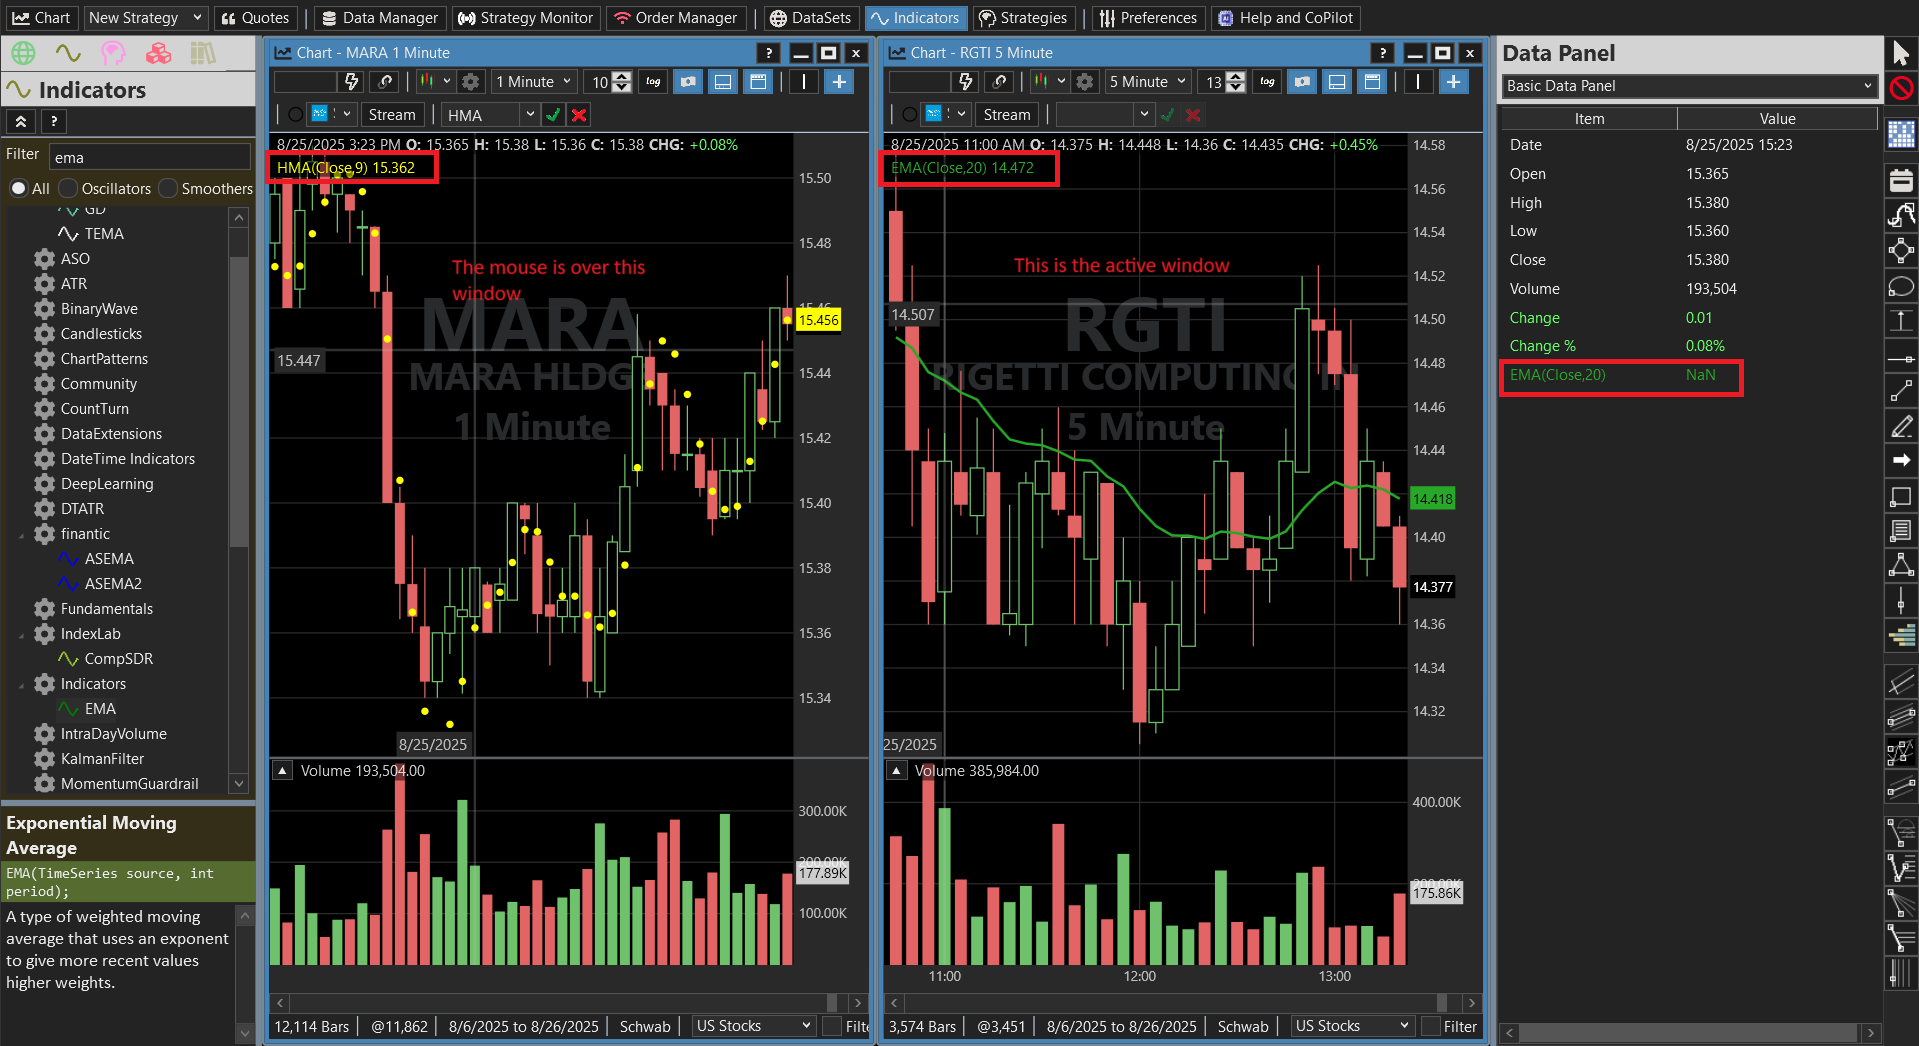
Incorrect indicators are being shown in the data panel when using two or more charts. To recreate the problem:
1. Go to menu View and make sure "Show Data Panel" is checked and the data panel is showing with Basic Data Panel selected in the data panel choice dropdown.
2. Display a chart
3. Display a second chart, but set its symbol to something other than the first chart's symbol
4. Tile the windows vertically to make the problem easier to see.
5. Add an indicator to the first chart (say HMA(9))
6. Add a different indicator to the second chart (say EMA(20))
7. Activate the second chart by clicking on it. In the screenshot below, the chart is on the right and has symbol RGTI. Data panel information is correct when the mouse is over the active chart.
8. Move the mouse over the first chart. DO NOT click on the first chart. In the screenshot below, the chart is on the left and has symbol MARA. In the data panel, the correct bar information is shown, but the indicators are not correct. In this test, the indicators shown in the data panel are those of the second chart.
This problem occurs in Wealth-Lab 8 build 133.
I was writing a data panel when I ran into this issue. I validated that method GetItems is getting the correct bars and index, but wrong plotted indicators in the scenario described.

Rename
Yes, I see that the indicators will only change when the chart is activated (clicked.) I fixed it for the next release cycle so the data panel indicators will automatically stay in sync with whatever chart window the mouse is hovering over.
Your Response
Post
Edit Post
Login is required