Hello,
I really like the ability to plot a second symbol on the "price" pane, and that works well. My question is there a way to place an average connected to the second axis associated with the second price pane symbol?
Thank you in advance,
Bryce
I really like the ability to plot a second symbol on the "price" pane, and that works well. My question is there a way to place an average connected to the second axis associated with the second price pane symbol?
Thank you in advance,
Bryce
Rename
QUOTE:
is there a way to place an average connected to the second axis associated with the second price pane symbol?
I don't follow. You want to create a Price pane with two separate y-axes?
Yes, ScottPlot lets you do that. And version 4.1 is installed with WL. You'll need to code the setup in C# of course, but it's easy to do. See the example below.
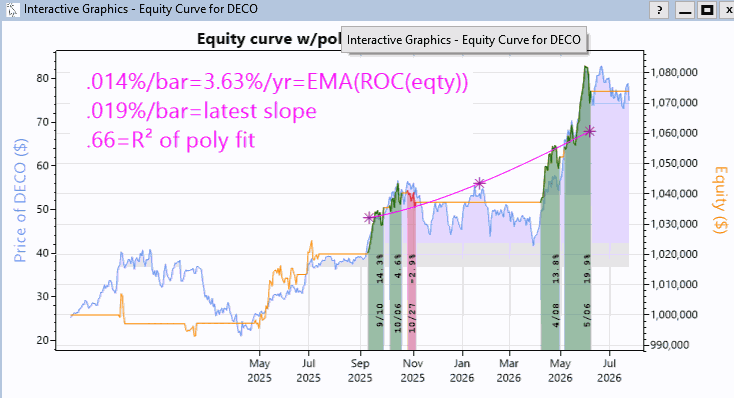
Alternatively, you could transform both price plots with the ROC indicator so the single y-axes is in percentage change, then both plots will fit on one WL pane. That would be simplest.
There isn't an easy way that I can think of. You'd have to rescale and plot the second symbol yourself to use the same scaling for the indicator(s).
I'd say to keep it simple and plot the second symbol and associated indicators in a separate pane.
I'd say to keep it simple and plot the second symbol and associated indicators in a separate pane.
Superticker,
Your example is very deluxe. Is there an example C# that demonstrates the screenshot?
Bryce
Your example is very deluxe. Is there an example C# that demonstrates the screenshot?
Bryce
I would start by searching the WL forum for ScottPlot examples. There are quite a few.
Then if you have questions, post them in that forum topic.
And check out this link for a simple plot. https://scottplot.net/cookbook/4.1/#multi-axis
Then if you have questions, post them in that forum topic.
And check out this link for a simple plot. https://scottplot.net/cookbook/4.1/#multi-axis
Superticker,
Thank you for the pointer to the many examples. This should be very helpful, especially after I get a debugger installed and attached to my strategy. One very basic question is the examples are all generated using the Plot object and there is an abstraction from "Price" pane to the actual price Plot object. How do I get the ScottPlot object?
Thank you for the pointer to the many examples. This should be very helpful, especially after I get a debugger installed and attached to my strategy. One very basic question is the examples are all generated using the Plot object and there is an abstraction from "Price" pane to the actual price Plot object. How do I get the ScottPlot object?
QUOTE:
How do I get the ScottPlot object?
There are several ways. The ScottPlot examples are creating a *.png file, so you need to open that file to see the plot with a Windows photo program.
The way I do it is with the WL finantic.InteractiveGraphics extension, which is sold separately. If you're going to be using ScottPlot a lot, then I would use that approach instead because it's more flexible. https://www.wealth-lab.com/extension/detail/finantic.InteractiveGraphics
The last paragraph of Post #1 also mentions transforming the two time series using the ROC indicator so both can share the same percentage change y-axis on a WL pane. And that's illustrated below with IBM and SPY. The WL code is pretty straightforward. And I use this approach on my broker's trading platform.
CODE:
using WealthLab.Backtest;
using WealthLab.Core;
using WealthLab.Indicators;

namespace WealthScript2
{
   public class SimplePlot : UserStrategyBase
   {
      public override void Initialize(BarHistory bars)
      {
         IndicatorBase rocStock = ROC.Series(bars.Close, 1);
         BarHistory spy = GetHistory(bars, "SPY");
         IndicatorBase rocIndex = ROC.Series(spy.Close, 1);
         PlotIndicator(rocStock,WLColor.Green);
         PlotIndicator(rocIndex, WLColor.DodgerBlue, paneTag: rocStock.PaneTag);
      }

      public override void Execute(BarHistory bars, int idx) { }
   }
}
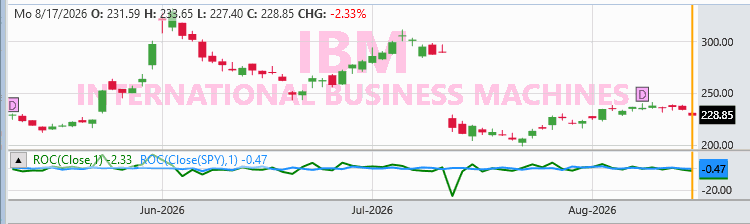
I attempted to code the above case in ScottPlot. The OffsetX is off, so the time scale is starting at the wrong point. I don't know how to correct that, so you will need to play with it. But this result will give you an idea of how ScottPlot 4.1 works.
Normally, I use ScottPlot for a scatter plot of the results of a backtest (for performance visualization), so its code would appear in Cleanup{} or BacktestComplete{}, but in this weird application the graph data is established in Initialize{}, so the ScottPlot code is placed there instead.
CODE:
using System;
using System.Drawing;
using WealthLab.Backtest;
using WealthLab.Core;
using WealthLab.Indicators;
using ScottPlot;

namespace WealthScript2
{
   public class SimplePlot : UserStrategyBase
   {
      public override void Initialize(BarHistory bars)
      {
         IndicatorBase rocStock = ROC.Series(bars.Close, 1);
         BarHistory spy = GetHistory(bars, "SPY");
         IndicatorBase rocIndex = ROC.Series(spy.Close, 1);
         PlotIndicator(rocStock,WLColor.Green);
         PlotIndicator(rocIndex, WLColor.DodgerBlue, paneTag: rocStock.PaneTag);

         Plot plt = new Plot(800, 400);
         plt.AddSignal(bars.Close.Values.ToArray(), color: Color.CornflowerBlue).FillBelow(Color.Blue, Color.Transparent);
         ScottPlot.Plottable.SignalPlot indexPlot = plt.AddSignal(spy.Close.Values.ToArray(), color: Color.Green);
         indexPlot.YAxisIndex = 1; //Index=1, build YAxis scale on right
         //indexPlot.OffsetX = bars.Close.DateTimes[0].ToOADate(); //set start date
         plt.XAxis.TickLabelFormat("MMM\nyyyy", dateTimeFormat: true); //display tick labels using a time format
         plt.YAxis.Ticks(true); plt.YAxis2.Ticks(true); //display YAxis ticks on left & right
         plt.YAxis.Grid(false); plt.YAxis2.Grid(true); //display YAxis grids for right (Equity) side
         plt.YAxis.Label("Price of " + bars.Symbol + " ($)", Color.CornflowerBlue);
         plt.YAxis2.Label("Price of " + spy.Symbol + " ($)", Color.Green);
         plt.Title(@"Price plot for " + bars.Symbol);
         plt.SaveFig(Environment.GetFolderPath(Environment.SpecialFolder.Desktop) + @"\simplePlot.png");
      }

      public override void Execute(BarHistory bars, int idx) { }
   }
}
Normally, I use ScottPlot for a scatter plot of the results of a backtest (for performance visualization), so its code would appear in Cleanup{} or BacktestComplete{}, but in this weird application the graph data is established in Initialize{}, so the ScottPlot code is placed there instead.
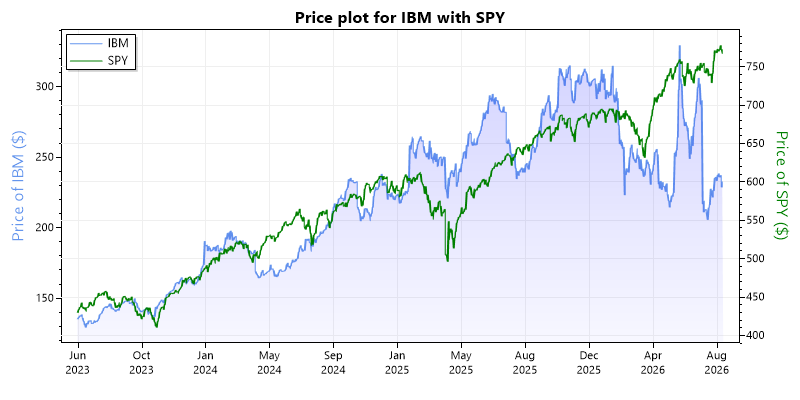
I got the ScottPlot code running correctly. But the resulting ScottPlot code isn't pretty. I would create a static method in your Visual Studio static class, WLUtility, with all the ScottPlot code so it never appears in any of your WL strategies. In fact, I never allow any foreign data types in my WL strategies; all external frameworks are called indirectly through local custom libraries. That way I avoid name clashes between different frameworks.
CODE:
using System;
using System.Drawing;
using WealthLab.Backtest;
using WealthLab.Core;
using WealthLab.Indicators;
using ScottPlot;

namespace WealthScript2
{
   public class SimplePlot : UserStrategyBase
   {
      public override void Initialize(BarHistory bars)
      {
         IndicatorBase rocStock = ROC.Series(bars.Close, 1);
         BarHistory spy = GetHistory(bars, "SPY");
         IndicatorBase rocIndex = ROC.Series(spy.Close, 1);
         PlotIndicator(rocStock,WLColor.Green);
         PlotIndicator(rocIndex, WLColor.DodgerBlue, paneTag: rocStock.PaneTag);

         Plot plt = new Plot(800, 400);
         plt.Legend(location: Alignment.UpperLeft);
         ScottPlot.Plottable.SignalPlot stockPlot = plt.AddSignal(bars.Close.Values.ToArray(), color: Color.CornflowerBlue, label: bars.Symbol);
         stockPlot.FillBelow(Color.Blue, Color.Transparent);
         ScottPlot.Plottable.SignalPlot indexPlot = plt.AddSignal(spy.Close.Values.ToArray(), color: Color.Green, label: spy.Symbol);
         indexPlot.YAxisIndex = 1; //Index=1, build YAxis scale on right
         double[] tickPositions = new double[11];
         string[] tickLabels = new string[11];
         double pos = 0.0;
         for (int idx = 0; idx < 11; idx++, pos += bars.Count/10.1)
         {
            tickPositions[idx] = pos;
            tickLabels[idx] = bars.Close.DateTimes[(int)pos].ToString("MMM\nyyyy");
         }
         plt.XTicks(tickPositions, tickLabels);

         plt.YAxis.Ticks(true); plt.YAxis2.Ticks(true); //display YAxis ticks on left & right
         plt.YAxis.Grid(false); plt.YAxis2.Grid(true); //display YAxis grids for right (SPY index) side
         plt.YAxis.Label("Price of " + bars.Symbol + " ($)", Color.CornflowerBlue);
         plt.YAxis2.Label("Price of " + spy.Symbol + " ($)", Color.Green);
         plt.Title(@"Price plot for " + bars.Symbol + " with " + spy.Symbol);
         plt.SaveFig(Environment.GetFolderPath(Environment.SpecialFolder.Desktop) + @"\simplePlot.png");
      }

      public override void Execute(BarHistory bars, int idx) { }
   }
}
Hello SuperTicker,
I finally got back to this issue. I have downloaded and installed finatic.InteractiveGraphics as a trial license. I have copied/pasted the example shown here into a new C# file named DemoScottPlot2. It compiles correctly using the WL built-in compiler. When I drag and drop the DemoScottPlot2 onto a chart, the display does not look anything like what you show. I only see an axis on the right for "IBM" and a ROC pane. I am likely doing something very basic incorrectly. Do you have any suggestions? I do see the ScottPlot.WPF.dll and ScottPlot.dll in the Wealth-Lab directory, but I wonder if I need a "newer" DLL or something.
I finally got back to this issue. I have downloaded and installed finatic.InteractiveGraphics as a trial license. I have copied/pasted the example shown here into a new C# file named DemoScottPlot2. It compiles correctly using the WL built-in compiler. When I drag and drop the DemoScottPlot2 onto a chart, the display does not look anything like what you show. I only see an axis on the right for "IBM" and a ROC pane. I am likely doing something very basic incorrectly. Do you have any suggestions? I do see the ScottPlot.WPF.dll and ScottPlot.dll in the Wealth-Lab directory, but I wonder if I need a "newer" DLL or something.
So when you installed finatic.InteractiveGraphics on WL8, that install should have added a new Help topic under Extensions called Interactive Graphics > IG Advanced Topics that you need to read. You are missing some C# lines required to talk to the Interactive Graphics extension.
I commented out the old lines for generating the *.png graphics file from Post #8 and added in the required Interactive Graphics lines--discussed in the Help docs--so it works now. Remember, you can define up to four separate graphs in one Interactive Graphics window as discussed in the Help docs.
I commented out the old lines for generating the *.png graphics file from Post #8 and added in the required Interactive Graphics lines--discussed in the Help docs--so it works now. Remember, you can define up to four separate graphs in one Interactive Graphics window as discussed in the Help docs.
CODE:Off topic, but you can also superimpose a ScottPlot *.bmp bitmap graphic directly over a WL Chart. Go go the QuickRef docs and run the example for UserStrategyBase > DrawImageAt.
//using System; using System.Drawing; using WealthLab.Backtest; using WealthLab.Core; using WealthLab.Indicators; using ScottPlot; using finantic.InteractiveGraphics; namespace WealthScript7 { public class SimplePlot : UserStrategyBase { public override void Initialize(BarHistory bars) { IndicatorBase rocStock = ROC.Series(bars.Close, 1); BarHistory spy = GetHistory(bars, "SPY"); IndicatorBase rocIndex = ROC.Series(spy.Close, 1); PlotIndicator(rocStock,WLColor.Green); PlotIndicator(rocIndex, WLColor.DodgerBlue, paneTag: rocStock.PaneTag); PlotHost.Instance.Clear(); Plot plt = PlotHost.Instance.Plot1; //Plot plt = new Plot(800, 400); plt.Legend(location: Alignment.UpperLeft); ScottPlot.Plottable.SignalPlot stockPlot = plt.AddSignal(bars.Close.Values.ToArray(), color: Color.CornflowerBlue, label: bars.Symbol); stockPlot.FillBelow(Color.Blue, Color.Transparent); ScottPlot.Plottable.SignalPlot indexPlot = plt.AddSignal(spy.Close.Values.ToArray(), color: Color.Green, label: spy.Symbol); indexPlot.YAxisIndex = 1; //Index=1, build YAxis scale on right double[] tickPositions = new double[11]; string[] tickLabels = new string[11]; double pos = 0.0; for (int idx = 0; idx < 11; idx++, pos += bars.Count/10.1) { tickPositions[idx] = pos; tickLabels[idx] = bars.Close.DateTimes[(int)pos].ToString("MMM\nyyyy"); } plt.XTicks(tickPositions, tickLabels); plt.YAxis.Ticks(true); plt.YAxis2.Ticks(true); //display YAxis ticks on left & right plt.YAxis.Grid(false); plt.YAxis2.Grid(true); //display YAxis grids for right (SPY index) side plt.YAxis.Label("Price of " + bars.Symbol + " ($)", Color.CornflowerBlue); plt.YAxis2.Label("Price of " + spy.Symbol + " ($)", Color.Green); plt.Title(@"Price plot for " + bars.Symbol + " with " + spy.Symbol); //plt.SaveFig(Environment.GetFolderPath(Environment.SpecialFolder.Desktop) + @"\simplePlot.png"); PlotHost.Instance.Refresh(); PlotHost.Instance.SetWindowTitle("Price profile for " + bars.Symbol + " with " + spy.Symbol); } public override void Execute(BarHistory bars, int idx) { } } }
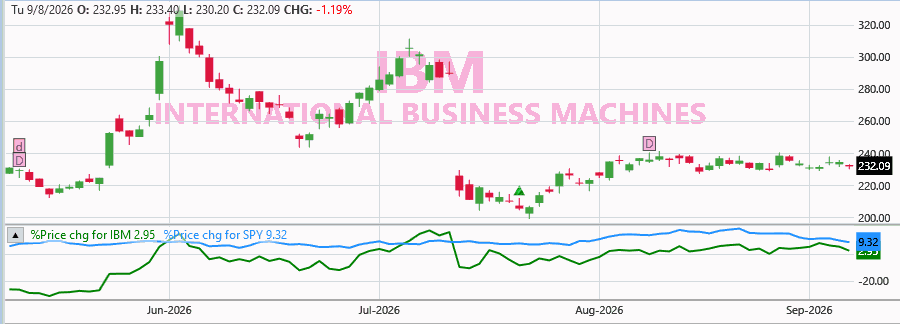
To expand on my solution in Post #6, I repeated the solution so you can see the percentage change in prices over 100 bars. The point here is to transform the instrument prices so they can both fit on the same y-axis scale of the WL Chart.
CODE:
using WealthLab.Backtest;
using WealthLab.Core;
using WealthLab.Indicators;

namespace WealthScript1
{
   public class PricePctChgPlot : UserStrategyBase
   {
      public override void Initialize(BarHistory bars)
      {
         IndicatorBase rocStock = ROC.Series(bars.Close, 1);
         BarHistory spy = GetHistory(bars, "SPY");
         IndicatorBase rocIndex = ROC.Series(spy.Close, 1);
         IndicatorBase rocStockIntegrated = new Sum(rocStock,100);
         IndicatorBase rocIndexIntegrated = new Sum(rocIndex,100);
         PlotTimeSeries(rocStockIntegrated,"%Price chg for "+bars.Symbol,"%Price",WLColor.Green);
         PlotTimeSeries(rocIndexIntegrated,"%Price chg for SPY","%Price", WLColor.DodgerBlue);
      }

      public override void Execute(BarHistory bars, int idx) { }
   }
}
Your Response
Post
Edit Post
Login is required