Consider this Equity Curve:
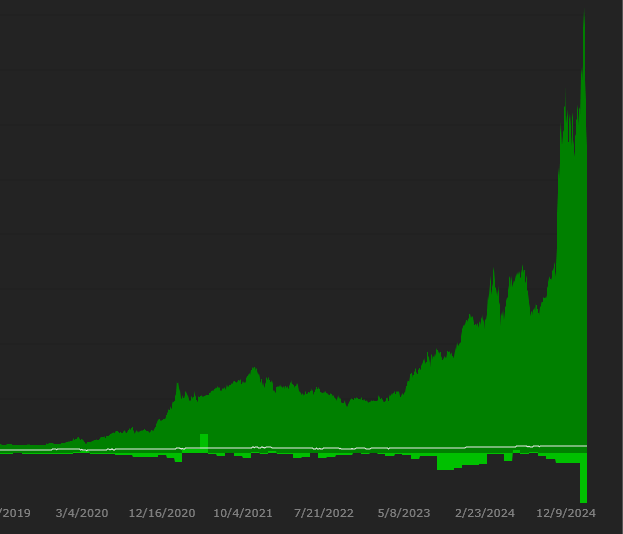
Ask 10 people to mark the current spot, you'll get 10 different answers.
Yes, you can hover your mouse incessantly but you're still unsure if you're looking at the spot you wanted, not to mention wasting time.
Yes, you can zoom but its cumbersome and if one wants to review a bunch of plots quickly - well, good luck.
Now consider this chart from Market Watch (also a Mountain Plot, just like the Eq and DD curves):
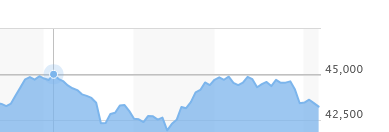
The exact spot is easily located w/o the mouse even having to be close by.
=================================================
Advantages of using a dot to precisely locate a spot:
- Simple, easy, intuitive
- Provides visual confirmation of spot being evaluated
- Mouse doesn't have to be near, the dot is marked on the curve at the same vertical plane as the mouse
- With precise location, one can precisely identify the peaks & troughs, or any other spot, with corresponding values displayed below w/o guesswork and unnecessary mouse movements (Note: No mouse-over values are provided on the Drawdown Curve tab, it's a shortcoming; the developers will have to add those for the dot to work)
- Can also be offered on the Price Pane (especially useful with a Line plot)
Suggestions on ways to implement:
- 2-3 mm dot
- appropriate contrasting color (user-defined ??) e.g. red for the green Eq Curve and yellow for the red DD curve
- reduced opacity of the dot (50% or less) so one can see-through instead of masking the spot
- option to show/not show the dot
=================================================
TLDR;
A simple solution to the vexing problem of quickly, accurately and visually locating specific spots along the Equity & Drawdown Curves is presented.
Ask 10 people to mark the current spot, you'll get 10 different answers.
Yes, you can hover your mouse incessantly but you're still unsure if you're looking at the spot you wanted, not to mention wasting time.
Yes, you can zoom but its cumbersome and if one wants to review a bunch of plots quickly - well, good luck.
Now consider this chart from Market Watch (also a Mountain Plot, just like the Eq and DD curves):
The exact spot is easily located w/o the mouse even having to be close by.
=================================================
Advantages of using a dot to precisely locate a spot:
- Simple, easy, intuitive
- Provides visual confirmation of spot being evaluated
- Mouse doesn't have to be near, the dot is marked on the curve at the same vertical plane as the mouse
- With precise location, one can precisely identify the peaks & troughs, or any other spot, with corresponding values displayed below w/o guesswork and unnecessary mouse movements (Note: No mouse-over values are provided on the Drawdown Curve tab, it's a shortcoming; the developers will have to add those for the dot to work)
- Can also be offered on the Price Pane (especially useful with a Line plot)
Suggestions on ways to implement:
- 2-3 mm dot
- appropriate contrasting color (user-defined ??) e.g. red for the green Eq Curve and yellow for the red DD curve
- reduced opacity of the dot (50% or less) so one can see-through instead of masking the spot
- option to show/not show the dot
=================================================
TLDR;
A simple solution to the vexing problem of quickly, accurately and visually locating specific spots along the Equity & Drawdown Curves is presented.
Rename
I wish it was easy to do in TeeChart but I can’t find an easy solution. But it might be possible with more effort so let’s leave the request open for now.
Ok.
In an effort to save you time and effort I posed the question to a friendly, neighborhood AI. Here's a summary of the response:
1) Implementation in C#:
2) Implementation in TeeChart/.NET:
This code creates a vertical cursor that follows the mouse and an annotation tool that displays the X and Y values at the current mouse position. Key differences from the previous implementation include:
1. Use of TeeChart-specific classes like CursorTool and AnnotationTool.
2. The CalcPosPoint method is used to convert screen coordinates to chart values.
3. The annotation's position is set using Left and Top properties instead of Shape.Left and Shape.Top.
4. The Active property is used to show/hide the annotation based on mouse position.
Remember to adjust the formatting of the annotation text and its appearance as needed for your specific chart requirements. This implementation provides a smooth experience for displaying cursor information on a TeeChart for .NET chart.
-----------------------------
Hope this helps.
1) Implementation in C#:
CODE:
using System.Windows.Forms.DataVisualization.Charting;

// Assume 'chart1' is your Chart control
private Annotation dotAnnotation;

public Form1()
{
    InitializeComponent();
    InitializeDotAnnotation();
    chart1.MouseMove += Chart1_MouseMove;
}

private void InitializeDotAnnotation()
{
    dotAnnotation = new EllipseAnnotation
    {
        AxisX = chart1.ChartAreas[0].AxisX,
        AxisY = chart1.ChartAreas[0].AxisY,
        Width = 6, // 3mm dot (adjust as needed)
        Height = 6,
        LineColor = Color.Red,
        BackColor = Color.FromArgb(128, Color.Red), // 50% opacity
        Visible = false
    };
    chart1.Annotations.Add(dotAnnotation);
}

private void Chart1_MouseMove(object sender, MouseEventArgs e)
{
    ChartArea chartArea = chart1.ChartAreas[0];
    Axis xAxis = chartArea.AxisX;
    Axis yAxis = chartArea.AxisY;

    // Convert mouse coordinates to chart values
    double xValue = xAxis.PixelPositionToValue(e.X);
    double yValue = yAxis.PixelPositionToValue(e.Y);

    // Update dot position
    dotAnnotation.X = xValue;
    dotAnnotation.Y = yValue;
    dotAnnotation.Visible = true;

    chart1.Invalidate(); // Redraw the chart
}
2) Implementation in TeeChart/.NET:
CODE:
using Steema.TeeChart;
using Steema.TeeChart.Tools;

private CursorTool cursorTool;
private AnnotationTool annotationTool;

public Form1()
{
    InitializeComponent();
    InitializeChartTools();
    tChart1.MouseMove += TChart1_MouseMove;
}

private void InitializeChartTools()
{
    cursorTool = new CursorTool(tChart1.Chart)
    {
        FollowMouse = true,
        Style = CursorToolStyles.Vertical
    };
    tChart1.Tools.Add(cursorTool);

    annotationTool = new AnnotationTool(tChart1.Chart)
    {
        Shape = { CustomPosition = true },
        TextAlign = StringAlignment.Center
    };
    tChart1.Tools.Add(annotationTool);
}

private void TChart1_MouseMove(object sender, MouseEventArgs e)
{
    if (tChart1.Series.Count == 0) return;

    double xValue = tChart1.Axes.Bottom.CalcPosPoint(e.X);
    double yValue = tChart1.Axes.Left.CalcPosPoint(e.Y);

    // Update annotation text and position
    annotationTool.Text = $"X: {xValue:F2}\nY: {yValue:F2}";
    annotationTool.Left = e.X + 10;
    annotationTool.Top = e.Y + 10;

    // Ensure annotation stays within chart bounds
    if (annotationTool.Left + annotationTool.Width > tChart1.Width)
        annotationTool.Left = e.X - annotationTool.Width - 10;
    if (annotationTool.Top + annotationTool.Height > tChart1.Height)
        annotationTool.Top = e.Y - annotationTool.Height - 10;

    // Show annotation only when mouse is over chart area
    annotationTool.Active = tChart1.ChartRect.Contains(e.Location);

    tChart1.Invalidate();
}
This code creates a vertical cursor that follows the mouse and an annotation tool that displays the X and Y values at the current mouse position. Key differences from the previous implementation include:
1. Use of TeeChart-specific classes like CursorTool and AnnotationTool.
2. The CalcPosPoint method is used to convert screen coordinates to chart values.
3. The annotation's position is set using Left and Top properties instead of Shape.Left and Shape.Top.
4. The Active property is used to show/hide the annotation based on mouse position.
Remember to adjust the formatting of the annotation text and its appearance as needed for your specific chart requirements. This implementation provides a smooth experience for displaying cursor information on a TeeChart for .NET chart.
-----------------------------
Hope this helps.
I already asked ChatGPT and it came up with several solutions that were dead ends. But I'll try these out too!
The first solution is a dead end, there is no EllipseAnnotation in TeeChart.WPF.
The second option is a vertical cursor, while not a dot it might be the easiest next best thing?
Perhaps you can get it to be a dot with some tweaking?
If not, a vertical cursor will do.
If not, a vertical cursor will do.
Does this help?
CODE:
using Steema.TeeChart;
using Steema.TeeChart.Tools;

private AnnotationTool dotTool;

public Form1()
{
    InitializeComponent();
    InitializeChartTools();
    tChart1.MouseMove += TChart1_MouseMove;
}

private void InitializeChartTools()
{
    dotTool = new AnnotationTool(tChart1.Chart)
    {
        Shape = { CustomPosition = true },
        TextAlign = StringAlignment.Center,
        Shape = { ShapeStyle = Drawing.ShapeStyles.Circle },
        Shape = { Color = Color.FromArgb(128, Color.Red) }, // Semi-transparent red
        Shape = { Size = new Size(6, 6) } // 3mm dot (adjust as needed)
    };
    tChart1.Tools.Add(dotTool);
}

private void TChart1_MouseMove(object sender, MouseEventArgs e)
{
    if (tChart1.Series.Count == 0) return;

    double xValue = tChart1.Axes.Bottom.CalcPosPoint(e.X);
    double yValue = tChart1.Axes.Left.CalcPosPoint(e.Y);

    // Update dot position
    dotTool.Left = e.X - dotTool.Shape.Size.Width / 2;
    dotTool.Top = e.Y - dotTool.Shape.Size.Height / 2;

    // Show dot only when mouse is over chart area
    dotTool.Active = tChart1.ChartRect.Contains(e.Location);

    tChart1.Invalidate();
}
This looks like another hallucination. First of all, there's no AnnotationTool class. There is an Annotation class, but its Shape property is read-only. Also, it seems it's designed to render text annotations, not shapes.
I was able to get a vertical cursor going for Build 114.
Thanks for taking the time for this.
I read up a bit about TeeChart. I believe a dot can be drawn using the AfterDraw method. So just a couple of tweaks to your existing code:
Step 1: Track mouse movement (you may already have this exactly the same or your version may work the same/better)
Step 2: Draw the dot using AfterDraw
Lastly, call these inside the Chart creation/setup
Step 2 is the necessary one to create the dot which can be used instead of, or alongside, the cursor.
I request your indulgence one last time. Can you please check if this works?
I read up a bit about TeeChart. I believe a dot can be drawn using the AfterDraw method. So just a couple of tweaks to your existing code:
Step 1: Track mouse movement (you may already have this exactly the same or your version may work the same/better)
CODE:
      private void Chart_MouseMove(object sender, MouseEventArgs e)
      {
         // Check if the mouse position is within the chart's boundaries
         if (chart.ClientRectangle.Contains(e.Location))
         {
            // Get the X position in the chart based on mouse position
            mouseXValue = chart.Axes.Bottom.Invert ?
               chart.Axes.Bottom.Maximum - chart.Axes.Bottom.CalcXPosValue(e.X) : chart.Axes.Bottom.CalcXPosValue(e.X);

            // Refresh the chart to draw the dot at the new price level
            chart.Refresh();
         }
      }
Step 2: Draw the dot using AfterDraw
CODE:
      private void Chart_AfterDraw(object sender, EventArgs e)
      {
         // Create a Graphics object to draw on the chart
         using (Graphics g = chart.Graphics)
         {
            // Set the size of the dot
            int dotSize = 6;

            // Get mouseXValue
            int xCoord = chart.Axes.Bottom.CalcXPosValue(mouseXValue);

            // Get the price level corresponding to the mouse's X position
            float correspondingPrice = chart.Axes.Left.Maximum -
               (chart.Axes.Left.Maximum - chart.Axes.Left.Minimum) * mouseXValue /
               (chart.Axes.Bottom.Maximum - chart.Axes.Bottom.Minimum);

            // Calculate the Y position for the corresponding price level
            int yCoord = chart.Axes.Left.CalcYPosValue(correspondingPrice);

            // Create a semi-transparent red brush for the dot
            Color semiTransparentRed = Color.FromArgb(128, Color.Red);
            using (Brush brush = new SolidBrush(semiTransparentRed))
            {
               // Draw a filled ellipse (dot) on the chart at the calculated coordinates
               g.FillEllipse(brush, xCoord - dotSize / 2, yCoord - dotSize / 2,
               dotSize, dotSize);
            }
         }
      }
Lastly, call these inside the Chart creation/setup
CODE:
      ...
      ...
      // Subscribe to the MouseMove event
      chart.MouseMove += Chart_MouseMove;

      // Subscribe to the AfterDraw event
      chart.AfterDraw += Chart_AfterDraw;
Step 2 is the necessary one to create the dot which can be used instead of, or alongside, the cursor.
I request your indulgence one last time. Can you please check if this works?
Your Response
Post
Edit Post
Login is required