Hello, please tell me: is this a bug or am I doing something wrong?
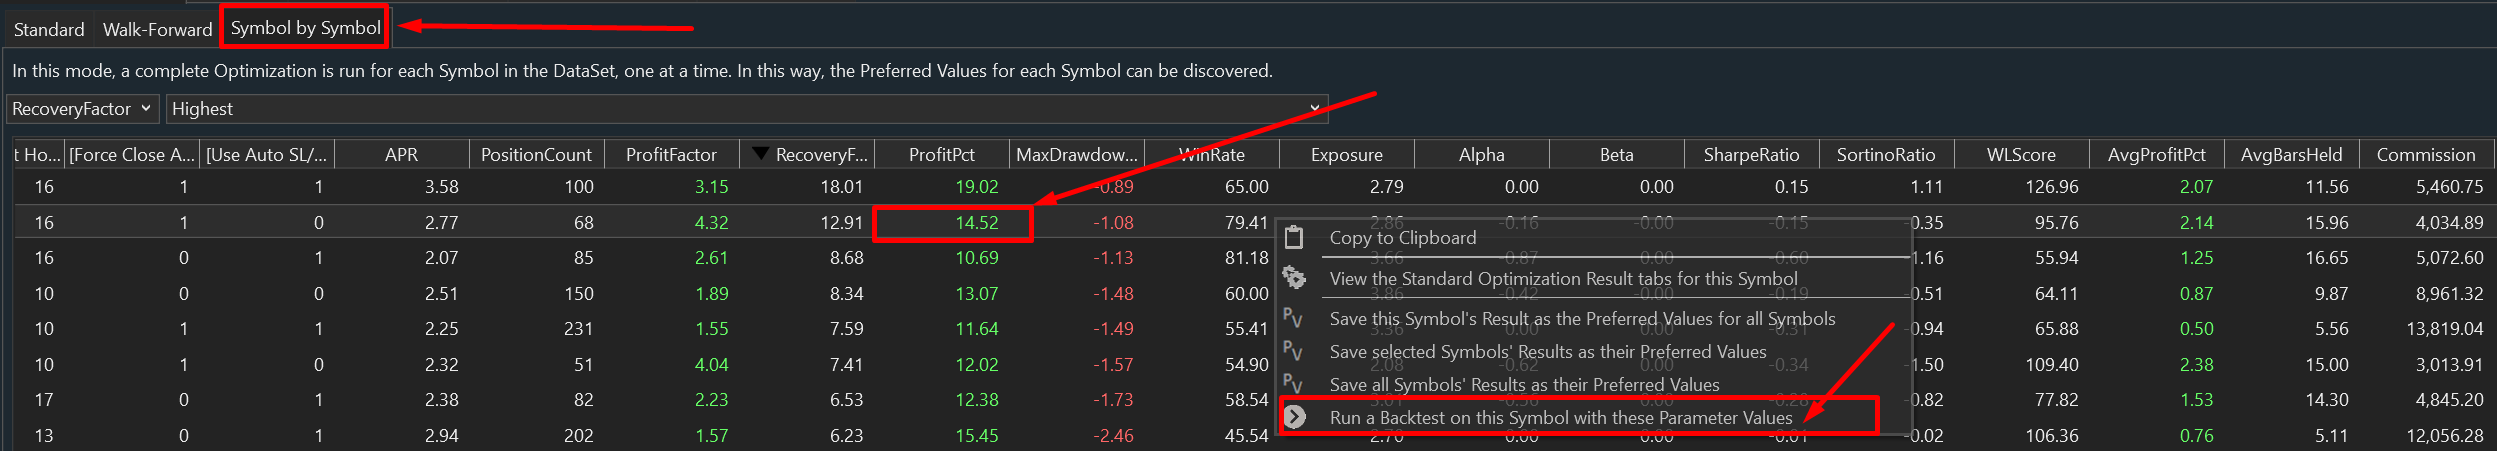
I use Symbol-by-symbol optimization, and after it is finished, I right-click on the results tab on one of the symbols and choose "Run a backtest on this symbol with these parameter values".
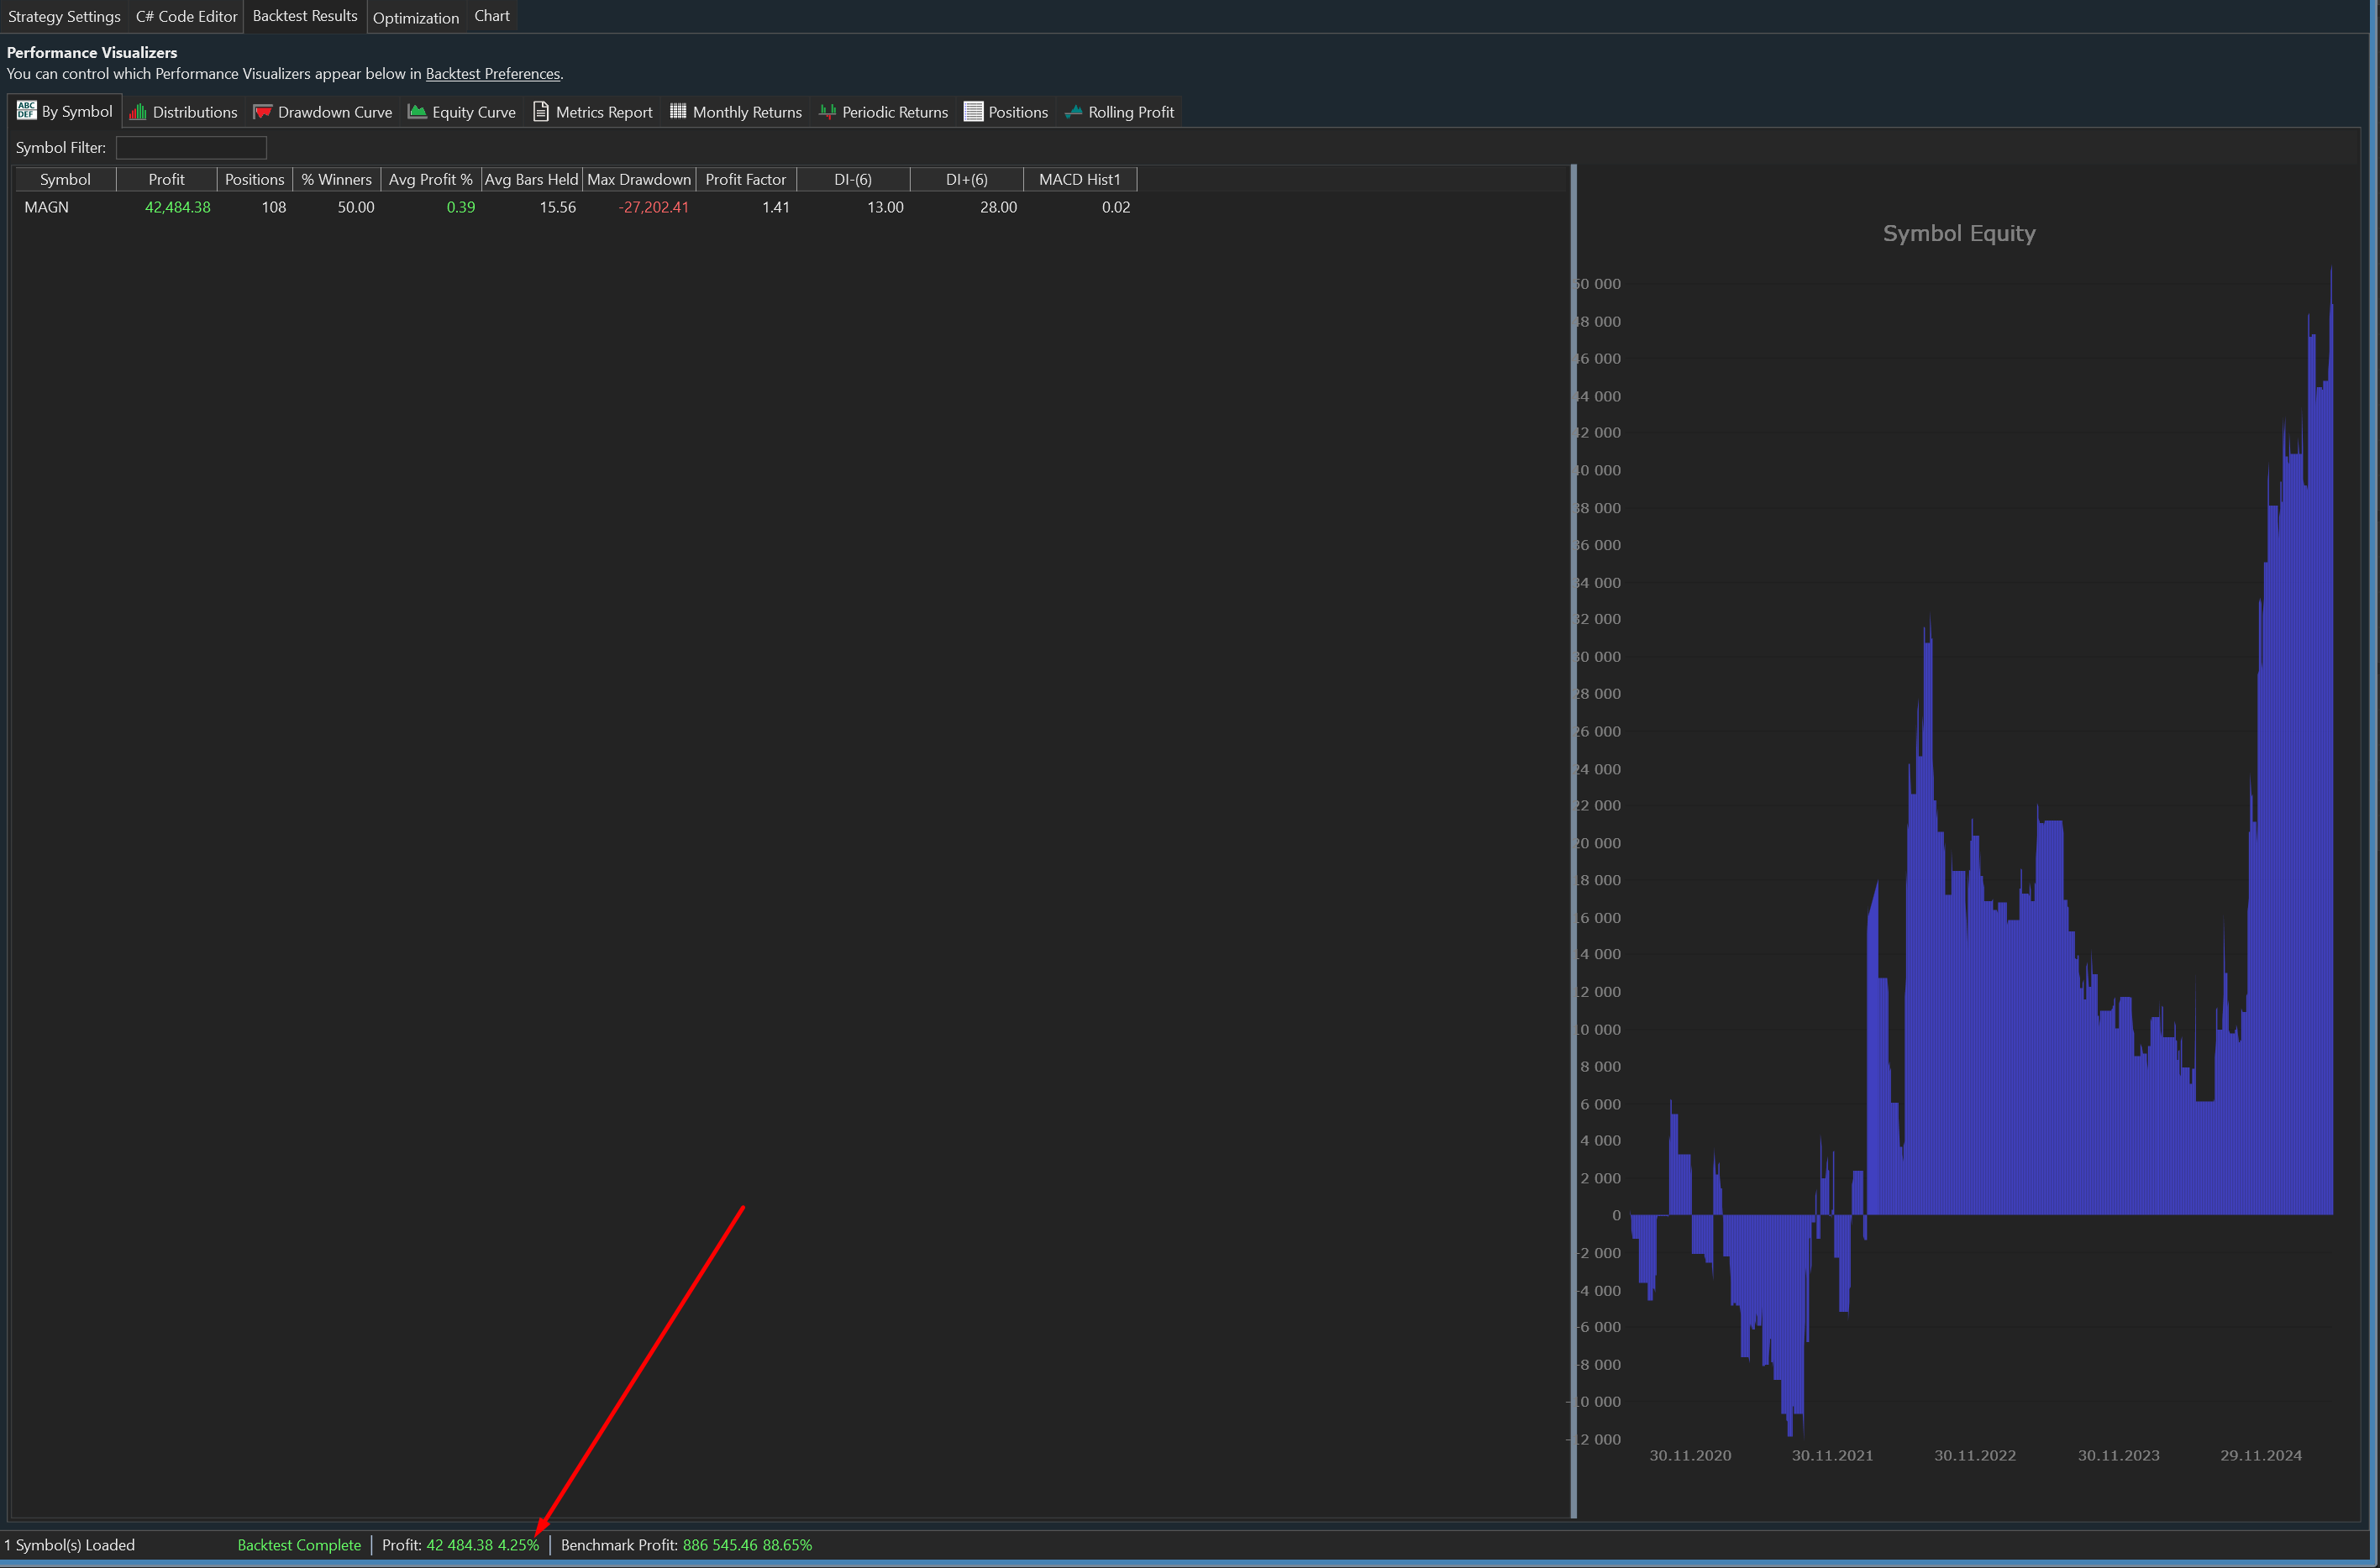
Then I go to the "Backtest results" tab, and after the backtest is finished, I see completely different results! Check the 2 screenshots.
Is this possible, and what are the reasons?
It's not happening every time. And I have never seen it when I use 1 symbol optimization.
I use Symbol-by-symbol optimization, and after it is finished, I right-click on the results tab on one of the symbols and choose "Run a backtest on this symbol with these parameter values".
Then I go to the "Backtest results" tab, and after the backtest is finished, I see completely different results! Check the 2 screenshots.
Is this possible, and what are the reasons?
It's not happening every time. And I have never seen it when I use 1 symbol optimization.
Rename
It's hard to say why you got that result, but the report lacks info to help determine it - Symbols missing, no settings, preferences, metrics report, or even strategy type.
Clearly it's a completely different backtest because the one you're pointing to had 68 positions and the one on the bottom is showing 108.
Start there.
Clearly it's a completely different backtest because the one you're pointing to had 68 positions and the one on the bottom is showing 108.
Start there.
Never mind, I ran one myself and after checking about 10 symbols that all showed the same results as the optimization, I ran into one that did not. We'll look into it.
Early findings: in these cases, the Symbol by Symbol result does not match the "dedicated" optimization.
Early findings: in these cases, the Symbol by Symbol result does not match the "dedicated" optimization.
Okay, hope that it would be easy for you to fix it.
Good luck! Will wait for good news from you.
Good luck! Will wait for good news from you.
I have noticed (some time ago) that the Symbol-by-Symbol optimization always produces better results than the Single-Symbol optimization for the SMAC optimizer.
I have no idea if this is a problem with the optimizer itself (or if it depends on the optimizer being used), or a problem with WL.Core passing a different problem to the optimizer in both these situations. And trying to track down such a problem is complicated, so I just choose to ignore it (and not report it).
My "theory" is that the Backtester burps occasionally and throws out bogus results to the extensions. For example, take the Basic ScoreCard extension. There's nothing wrong with its calculations, but in Single-Symbol mode, sometimes you get unbelievable results.
It's possible this happens all the time, but the System-by-Symbol mode averages the results better to disguise the problem--I don't know. In Single-Symbol mode, if the numbers don't look right, just ignore them.
I suppose you could add some error capturing logs to try to catch these Backtester errors. But unless you capture what the Backtester is bogusly saying to the extension, it's going to be hard to nail the problem. Happy debugging. :)
Resolved - both results are correct.
When you run a Symbol by Symbol optimization on a dynamic DataSet (I'm assuming you did), WealthLab respects the dates in the dynamic DataSet, i.e., the optimization is over the period that the symbol was a constituent in the index/DataSet.
When you run the symbol "offline" you can get a different result since data for the entire test period is available to it.
Consequently, the result is by design. If you want to test a Symbol by Symbol without the "date dynamics", create/use a DataSet that isn't dynamic.
Tip!
How to Create a list of the current symbols from a Dynamic DataSet
1. Open a new Quotes window,
2. Drag the DataSet into it
3. Right click, copy to Clipboard, paste to Excel.
4. Copy the list of the current symbols from the first column.
(Note to Glitch - it would a handy feature to right click a DataSet >> Copy Current List to Clipboard.)
QUOTE:
"When you run a Symbol by Symbol optimization on a dynamic DataSet (I'm assuming you did)"
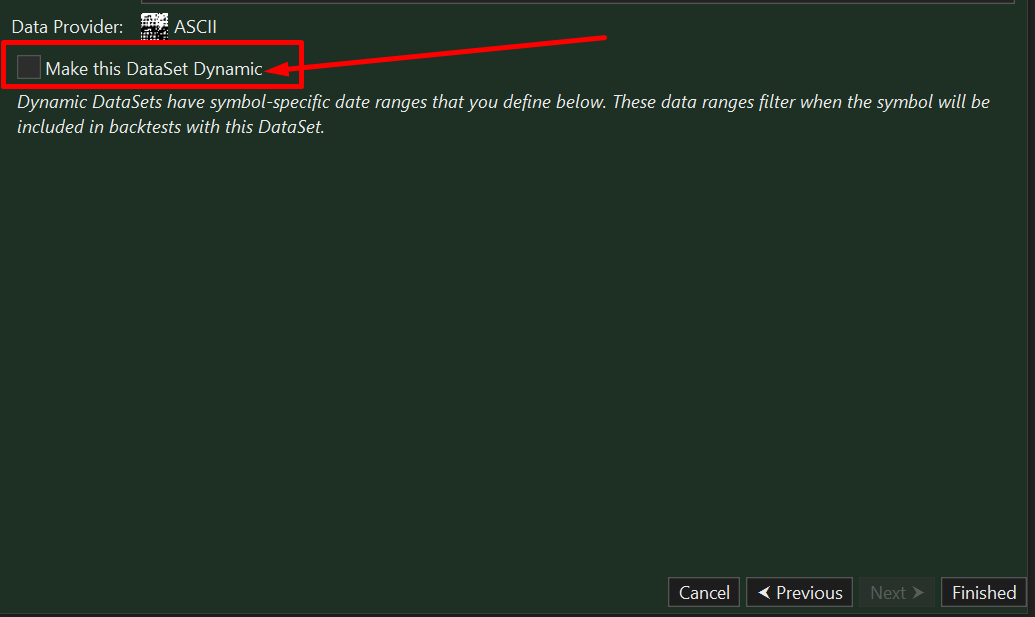
I checked all my Datasets and they all are NOT dynamic. Am I right, that if the checkbox is off, then dataset will be NOT dynamic? (screenshot)
If I'm right, then the problem is not resolved.
QUOTE:
If I'm right, then the problem is not resolved.
I believe you, and the problem is not resolved. I "think" (but I could be wrong) the backtester is returning inconsistent bt.Positions.ProfitPercent data, which messes up extensions (such as optimizers and ScoreCard extensions) from one invocation to the next. The problem is proving it! And that's why I haven't reported this problem 12 months ago.
If there's a bug you want fixed, you need to write code that illustrates the bug and find a case that reproduces it reliably; otherwise, it's not worth reporting. In this particular case, you're going to have to write a custom extension that examines the bt.Positions List between invocations for consistency in single-symbol mode and records which cases don't match up right.
Look at the Post #4 screenshot. Notice that the two Sharpe Ratio calculations don't match up even though they should. That's because the backtester is delivering different bt.Positions ProfitPercent values to the Basic ScoreCard extension for the "Strategy column case" and the "Long column case" invocation when it shouldn't be. But the problem is proving it and reproducing it--that's tricky.
Meanwhile, I just ignore bogus behavior.
And this is why I started with the statements in Post #1.
In the only case I could find (because I had to guess), it was due to using Wealth-Data (dynamic) DataSets.
Export and send your script and ASCII Data (or post it somewhere to download) to info@wealth-lab.com with a reference to this url. The problem is highly likely (99%) to be data dependent, so that's the most important piece of the puzzle.
---
@superticker
Re: the backtester is returning inconsistent bt.Positions.ProfitPercent data, which messes up extensions (such as optimizers and ScoreCard extensions) from one invocation to the next.
This isn't helpful and confuses this discussion. Start a new topic and include your evidence instead of adding confusion and incorrect information (imho) here. Profit calculations are very concise and they are not in error. Data is often to blame. Futures profits are calculated differently. There are reasons for results you many not understand. Don't answer me here. Prove me wrong in another topic. I can be wrong, but computers don't make mistakes. Thanks in advance.
Here is the test strategy (attached) - errors occure every symbol-by-symbol dataset optimization. Dataset is not dynamic (checkbox is off).
Here are the ASCII quotes, 2 tickers - https://filebin.net/qc2m1e651j2h4n4e
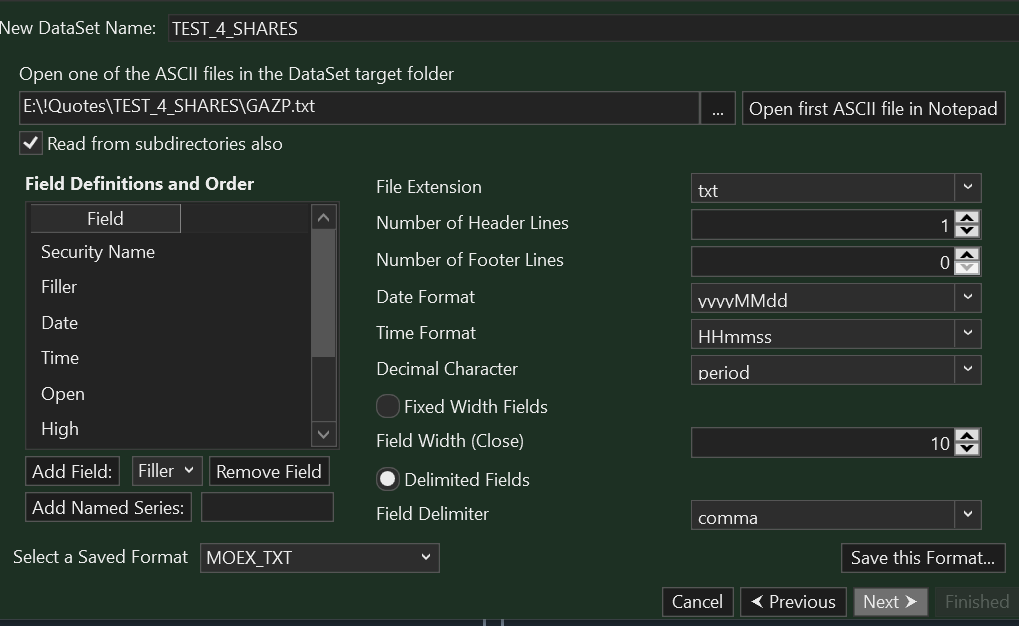
I've also attached the screenshot with settings for ASCII dataset.
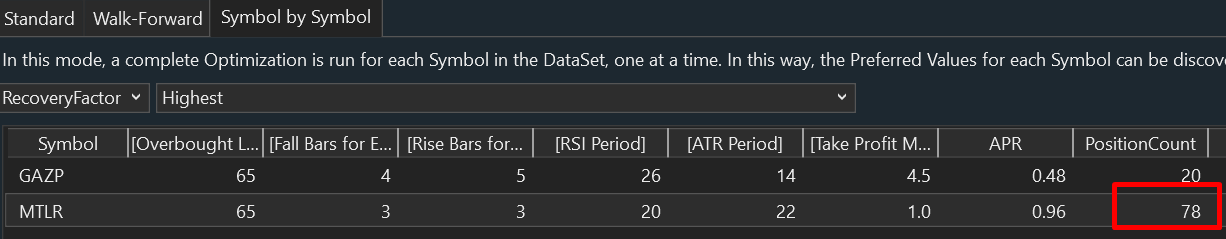
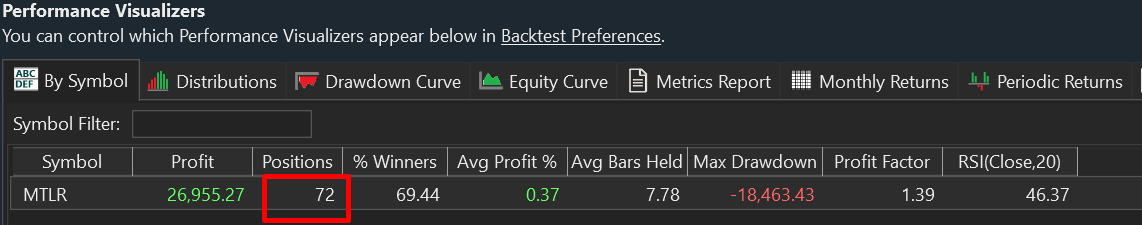
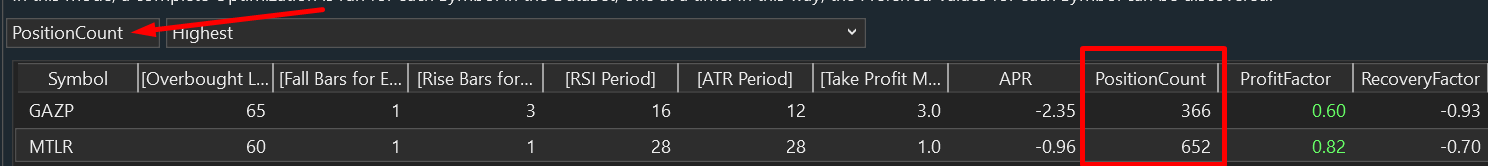
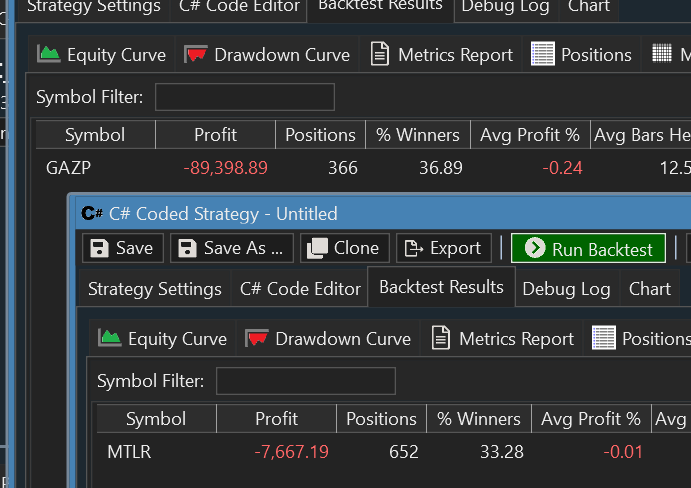
Here you can see the difference between orders quantity:
Here are the ASCII quotes, 2 tickers - https://filebin.net/qc2m1e651j2h4n4e
I've also attached the screenshot with settings for ASCII dataset.
Here you can see the difference between orders quantity:
CODE:
<?xml version="1.0" encoding="utf-8"?> <Strategy xmlns:xsi="<a href="http://www.w3.org/2001/XMLSchema-instance" target="_blank">http://www.w3.org/2001/XMLSchema-instance</a>" xmlns:xsd="<a href="http://www.w3.org/2001/XMLSchema" target="_blank">http://www.w3.org/2001/XMLSchema</a>"> <PreferredValues /> <ParameterValues> <double>70</double> <double>3</double> <double>2</double> <double>14</double> <double>14</double> <double>2</double> </ParameterValues> <Name>TEST_script_for_SUPPORT</Name> <Description>Enter a description for the Strategy here.</Description> <Author>Marat2233</Author> <CreationDate>2025-06-15T23:59:17.8932222+07:00</CreationDate> <StrategyType>Code</StrategyType> <StrategyData>using System; using WealthLab.Core; using WealthLab.Indicators; using WealthLab.Backtest; namespace WealthScript1 { public class SimpleShortRSI : UserStrategyBase { // Technical indicators private RSI rsi; private ATR atr; // Entry logic state variables private double rsiMaximum = 0; // RSI value at the "peak down" point private int fallBarsCounter = 0; // Counter of consecutive RSI falling bars private bool peakFound = false; // Flag indicating we found a downward reversal point // Exit logic state variables private int riseBarsCounter = 0; // Counter of consecutive RSI rising bars while in position // Position management variables private double entryPrice = 0; private double takeProfitLevel = 0; public SimpleShortRSI() : base() { AddParameter("Overbought Line", ParameterType.Int32, 70, 60, 80, 5); AddParameter("Fall Bars for Entry", ParameterType.Int32, 3, 1, 5, 1); AddParameter("Rise Bars for Exit", ParameterType.Int32, 2, 1, 5, 1); AddParameter("RSI Period", ParameterType.Int32, 14, 10, 30, 2); AddParameter("ATR Period", ParameterType.Int32, 14, 10, 30, 2); AddParameter("Take Profit Multiplier", ParameterType.Double, 2.0, 1.0, 5.0, 0.5); } public override void Initialize(BarHistory bars) { // Create technical indicators rsi = new RSI(bars.Close, Parameters[3].AsInt); atr = new ATR(bars, Parameters[4].AsInt); // Plot RSI indicator on chart PlotIndicator(rsi, WLColor.Blue); // Reset all state variables at backtest start rsiMaximum = 0; fallBarsCounter = 0; peakFound = false; riseBarsCounter = 0; entryPrice = 0; takeProfitLevel = 0; } public override void Execute(BarHistory bars, int idx) { // Need minimum bars for indicator calculations and comparison if (idx < Math.Max(Parameters[3].AsInt, Parameters[4].AsInt) + 2) return; // Get current market data double currentRSI = rsi[idx]; double previousRSI = rsi[idx - 1]; double dayBeforeRSI = rsi[idx - 2]; double currentPrice = bars.Close[idx]; double currentATR = atr[idx]; // Get strategy parameters double overboughtLine = (double)Parameters[0].AsInt; int requiredFallBars = Parameters[1].AsInt; int requiredRiseBars = Parameters[2].AsInt; // ENTRY LOGIC - Looking for short entry signal if (!HasOpenPosition(bars, PositionType.Short)) { // STEP 1: Find RSI peak (reversal from up to down) // Condition: RSI was rising, now falling, and above overbought line if (!peakFound && currentRSI < previousRSI && // RSI is falling now previousRSI >= dayBeforeRSI && // RSI was rising/flat before previousRSI > overboughtLine) // Previous RSI was in overbought zone { peakFound = true; rsiMaximum = previousRSI; // Remember the peak RSI value fallBarsCounter = 1; // Start counting falling bars DrawText($"PEAK! RSI={rsiMaximum:F1}", idx - 1, bars.High[idx - 1] * 1.01, WLColor.Orange, 8); WriteToDebugLog($"Found RSI peak at {rsiMaximum:F1}"); } // STEP 2: Count consecutive falling bars after peak else if (peakFound && currentRSI < previousRSI) { fallBarsCounter++; DrawText($"↓{fallBarsCounter}", idx, currentPrice * 1.005, WLColor.Gray, 6); } // STEP 3: Reset counter if RSI stops falling else if (peakFound && currentRSI >= previousRSI) { DrawText("RESET", idx, currentPrice * 0.995, WLColor.Yellow, 6); peakFound = false; fallBarsCounter = 0; rsiMaximum = 0; } // STEP 4: Enter SHORT when we have enough falling bars if (peakFound && fallBarsCounter >= requiredFallBars) { PlaceTrade(bars, TransactionType.Short, OrderType.Market); entryPrice = currentPrice; takeProfitLevel = entryPrice - currentATR * Parameters[5].AsDouble; // Subtract ATR for short DrawText($"SHORT ENTRY! Fall={fallBarsCounter}, TP={takeProfitLevel:F2}", idx, entryPrice * 1.02, WLColor.Green, 10); WriteToDebugLog($"Entered short: RSI={currentRSI:F1}, fall bars={fallBarsCounter}"); // Reset all entry-related counters after entering position fallBarsCounter = 0; peakFound = false; riseBarsCounter = 0; } } // EXIT LOGIC - Looking for exit signals while in short position else { // Check take profit condition (price dropped to target level) bool exitByTakeProfit = currentPrice <= takeProfitLevel; // Count consecutive RSI rising bars for stop-loss logic if (currentRSI > previousRSI) { riseBarsCounter++; // RSI is rising - increment counter DrawText($"↑{riseBarsCounter}", idx, currentPrice * 0.995, WLColor.Pink, 6); } else { // RSI stopped rising - reset counter if (riseBarsCounter > 0) { DrawText("RESET↑", idx, currentPrice * 0.995, WLColor.Cyan, 6); } riseBarsCounter = 0; } // Check stop-loss condition (RSI rising for required number of bars) bool exitByStop = riseBarsCounter >= requiredRiseBars; // Execute exit trades if (exitByTakeProfit) { ClosePosition(LastPosition, OrderType.Market); DrawText("TAKE PROFIT!", idx, currentPrice * 0.98, WLColor.Green, 10); WriteToDebugLog("Exit by take profit"); } else if (exitByStop) { ClosePosition(LastPosition, OrderType.Market); DrawText($"STOP! RSI rose {riseBarsCounter} bars", idx, currentPrice * 1.02, WLColor.Red, 10); WriteToDebugLog($"Exit by stop: RSI rising for {riseBarsCounter} consecutive bars"); } } } public override void BacktestComplete() { WriteToDebugLog("Backtest completed"); } } }</StrategyData> <LibraryName /> <FolderName>AR</FolderName> <DataSetName>MOEX_LAST;ASCII</DataSetName> <UseSelectedDataSetOnly>true</UseSelectedDataSetOnly> <SingleSymbolMode>false</SingleSymbolMode> <Scale> <Frequency>Minute</Frequency> <Interval>60</Interval> <FilterPrePost>true</FilterPrePost> </Scale> <DataRange> <DataRangeType>RecentYears</DataRangeType> <RecentValue>5</RecentValue> <StartDate>0001-01-01T00:00:00</StartDate> <EndDate>0001-01-01T00:00:00</EndDate> </DataRange> <PositionSize> <PositionSizeType>Dollar</PositionSizeType> <Amount>100000</Amount> <PositionSizerName /> <PositionSizerParameters /> <StartingCapital>1000000</StartingCapital> <MarginFactor>1</MarginFactor> <MaxOpenPositions>0</MaxOpenPositions> <MaxOpenPositionsLong>0</MaxOpenPositionsLong> <MaxOpenPositionsShort>0</MaxOpenPositionsShort> <MaxOpenPositionsInSymbol>0</MaxOpenPositionsInSymbol> <UseNextBarOpenAsBasisPrice>false</UseNextBarOpenAsBasisPrice> <StartingCapOptValues> <MinValue>50000</MinValue> <MaxValue>200000</MaxValue> <StepValue>10000</StepValue> </StartingCapOptValues> <FixedAmountOptValues> <MinValue>1000</MinValue> <MaxValue>10000</MaxValue> <StepValue>1000</StepValue> </FixedAmountOptValues> <PctEquityOptValues> <MinValue>1</MinValue> <MaxValue>20</MaxValue> <StepValue>1</StepValue> </PctEquityOptValues> <FixedQtyOptValues> <MinValue>100</MinValue> <MaxValue>1000</MaxValue> <StepValue>100</StepValue> </FixedQtyOptValues> <MarginOptValues> <MinValue>1</MinValue> <MaxValue>2</MaxValue> <StepValue>0.1</StepValue> </MarginOptValues> <MaxRiskOptValues> <MinValue>5</MinValue> <MaxValue>50</MaxValue> <StepValue>5</StepValue> </MaxRiskOptValues> <MaxOpenPosOptValues> <MinValue>1</MinValue> <MaxValue>1000</MaxValue> <StepValue>1</StepValue> </MaxOpenPosOptValues> <MaxSignalsPerBar>0</MaxSignalsPerBar> <StartingCapOpt>false</StartingCapOpt> <AmountOpt>false</AmountOpt> <MarginOpt>false</MarginOpt> <MaxOpenPosOpt>false</MaxOpenPosOpt> </PositionSize> <Benchmark>NG</Benchmark> <SingleSymbol>CHMF</SingleSymbol> <RunWithWFOParameters>false</RunWithWFOParameters> <RunWithPreferredValues>false</RunWithPreferredValues> <RetainNSF>true</RetainNSF> <GranularLimitStopScale> <Frequency>Daily</Frequency> <Interval>1</Interval> <FilterPrePost>true</FilterPrePost> </GranularLimitStopScale> <UpdateGranularData>true</UpdateGranularData> <IsWLComPublishedStrategy>false</IsWLComPublishedStrategy> <IsWLComUserStrategy>false</IsWLComUserStrategy> <MarkedReadOnly>false</MarkedReadOnly> <IsRunningInEvolver>false</IsRunningInEvolver> <CouldOptimize>true</CouldOptimize> <ParametersEnabled> <string>Overbought Line</string> <string>Fall Bars for Entry</string> <string>Rise Bars for Exit</string> <string>RSI Period</string> <string>ATR Period</string> <string>Take Profit Multiplier</string> </ParametersEnabled> <IsLinkedToExternalFile>false</IsLinkedToExternalFile> <LinkedFileName /> <CompiledStrategyTypeName /> </Strategy>
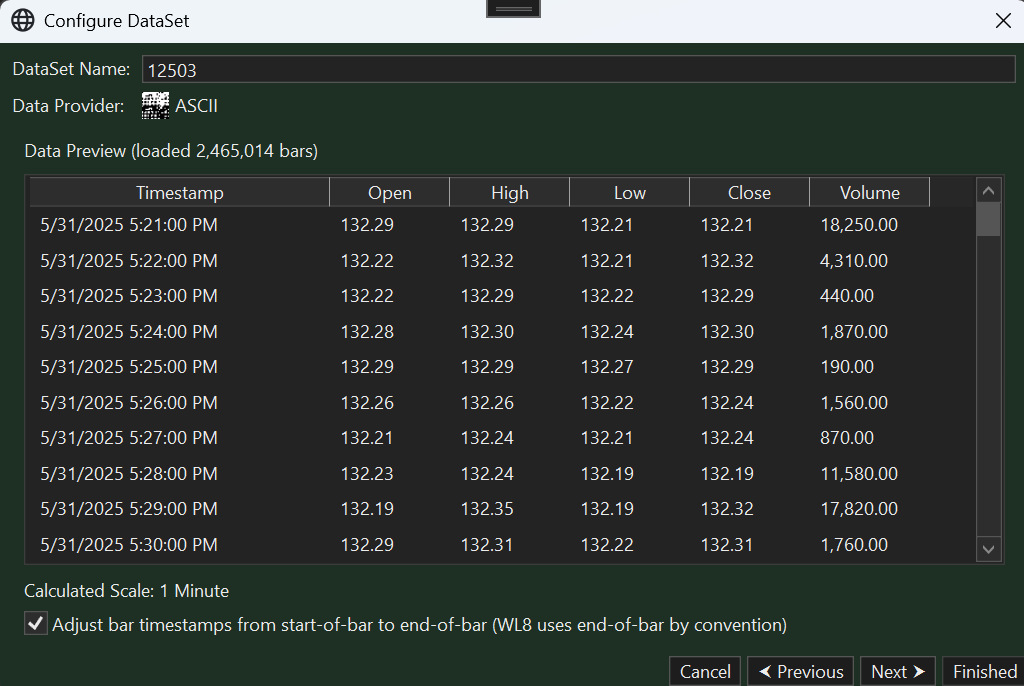
What market does this data correspond to?
The (GAZP) trading day start times range from 10:00 to 10:30, and end times at 16:40, 16:45, 16:50, and finally go from 10:00 to midnight. What are we working with here?
These are 1-minute data and it looks like you're scaling to 60 minute bars, so the market is important.
The MLTR data is more sparse and throws it's own set of trading times into the mix, ending at 18:50, for example, while GAZP is trading to midnight.
And, because you're scaling, you should have the "Adjust bar timestamps" box checked when setting up the DataSet -
My working assumption is that the Backtester is synchronizing the sparser data, MLTR, with GAZP, causing the trading difference in MLTR. The issue doesn't exist with GAZP, correct?
There's also another series involved, NG, the benchmark, which wasn't included in your download.
It's MOEX market.
The checkbox "adjust bar timestmaps" was off.
I tried just now to test with the checkbox and the problem is the same.
The checkbox "adjust bar timestmaps" was off.
I tried just now to test with the checkbox and the problem is the same.
QUOTE:
There's also another series involved, NG, the benchmark, which wasn't included in your download.
I will try now without it and message you
I excluded NG from the Benchmark field. There is GAZP now but the issue is the same.
The issue exists in both tickers: GAZP and MTLR (try to sort by Positions quantity - if there will be a lot of trades, then you can see the issue in both tickers)


I have also checked 4 tickers and the issue is in 4 tickers.
QUOTE:
The issue doesn't exist with GAZP, correct?
The issue exists in both tickers: GAZP and MTLR (try to sort by Positions quantity - if there will be a lot of trades, then you can see the issue in both tickers)
I have also checked 4 tickers and the issue is in 4 tickers.
I'm just pointing out that the Data is very unsynchronized and inconsistent. The Backtester may make adjustments for that when the symbols are run in Portfolio Mode, which it wouldn't have to do when you run a Single Symbol backtest. This is the probably the difference. Glitch would have a better idea, but I have to dig deeper to find the reason. There will be one.
Glitch confirmed that the bar-by-bar synchronization for Portfolio backtests doesn't occur for Symbol-by-Symbol optimization.
That said, I could not duplicate the issue with your data. I didn't run the 132,000 permutation optimization, but I did one with 1300.
However, I actually duplicated your optimization result (at least the number of trades) using the parameters shown in Post #13-
I don't know what to tell you, your single symbol result is a mystery!
Your Response
Post
Edit Post
Login is required