Hello all,
New to WL8 and looking forward to learning. I see there are downward and upward trend lines in the Conditions section of the Building Blocks. If I wanted to create a horizontal trend line to use for back testing what would be the best way to do so?
Thanks,
Duce
New to WL8 and looking forward to learning. I see there are downward and upward trend lines in the Conditions section of the Building Blocks. If I wanted to create a horizontal trend line to use for back testing what would be the best way to do so?
Thanks,
Duce
Rename
"Horizontal" is (by definition) not a "Trend". Rather a constant value.
Please elaborate on what you're trying to accomplish.
Please elaborate on what you're trying to accomplish.
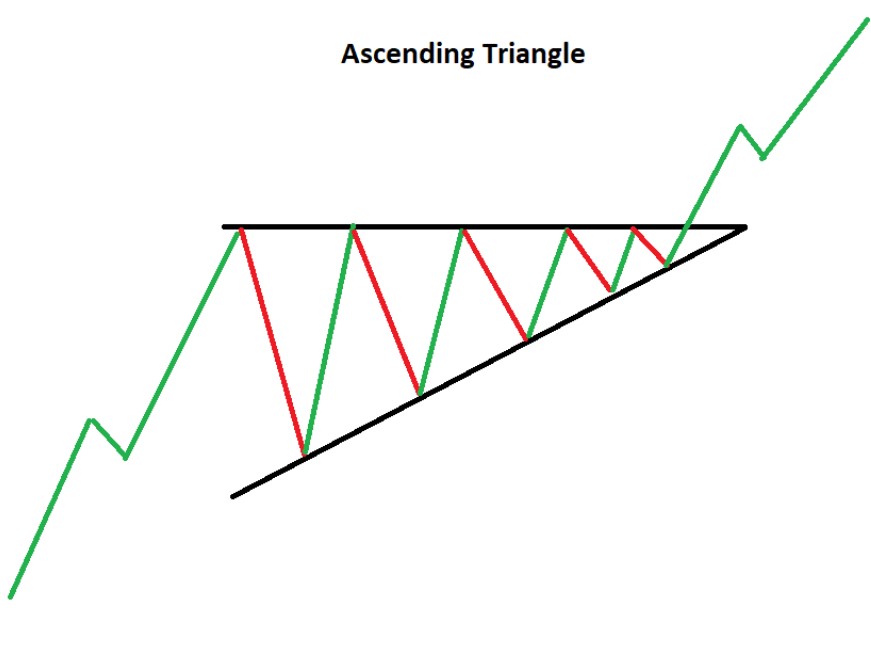
I am trying to create back test for a ascending triangle flag pattern with the top of the flag being horizontal and the bottom of the flag ascending to the right towards the horizontal line over time. This will be a bullish pattern with the expectation being that the price will eventually break out through the top of the horizontal line.
Ok, the term for this would be a "resistance" (or conversely, "support") level. A Resistance/Support Level is good idea for another block. I'll work on that.
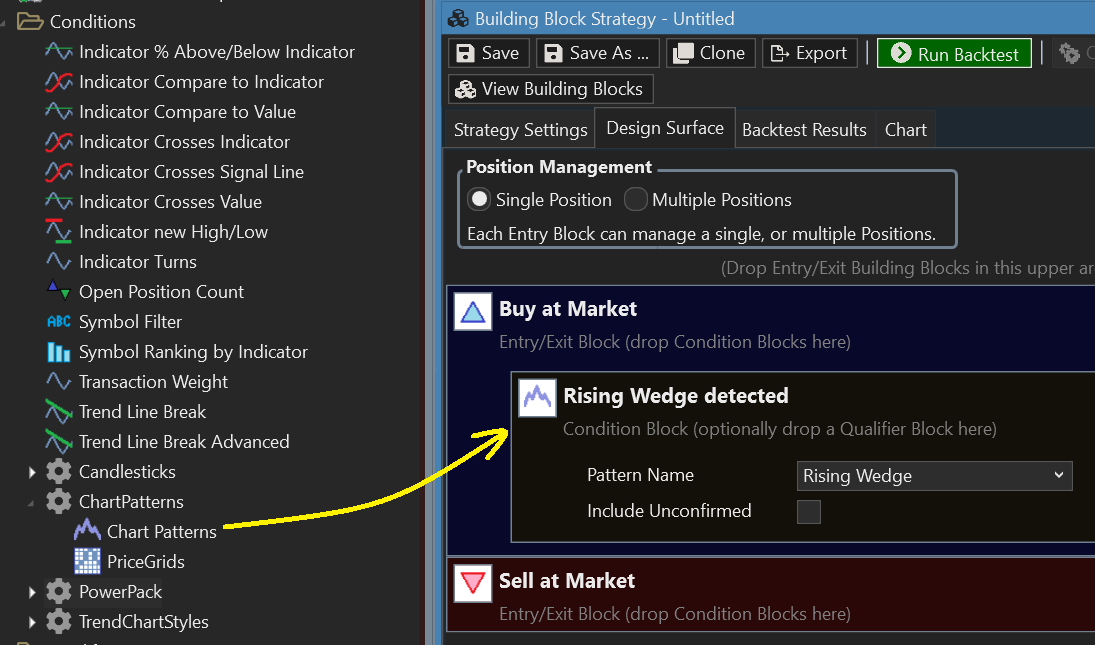
But the way to go for pattern detection is to use the Chart Patterns Extension and add your own patterns to it if required.
But the way to go for pattern detection is to use the Chart Patterns Extension and add your own patterns to it if required.
Thanks for sharing the chart pattern extension. I have installed it and am exploring the rising wedge pattern strategy. Is there a way to visually see the lines that WL8 is using as the bounds for the conditions? For example, I can see the trend line and the buy point that WL8 creates on the charts for the trend line break conditions but not the wedge pattern.
No. Chart Patterns use more general conditions that may or may not serve your purpose, and drawing the visual references aren't part of it.
See the Help > Extensions > Chart Patterns, where you'll find about ChartPatterns.txt. There you'll see how you can create patterns by mixing and matching pattern rules. Actually, there's one for Ascending Triangle too -
See the Help > Extensions > Chart Patterns, where you'll find about ChartPatterns.txt. There you'll see how you can create patterns by mixing and matching pattern rules. Actually, there's one for Ascending Triangle too -
CODE:
Ascending Triangle
Trendline Upper Flat
Trendline Lower Rising
PriceCrossesTrendline Close Above Upper Confirmation
QUOTE:
A Resistance/Support Level is good idea for another block. I'll work on that.
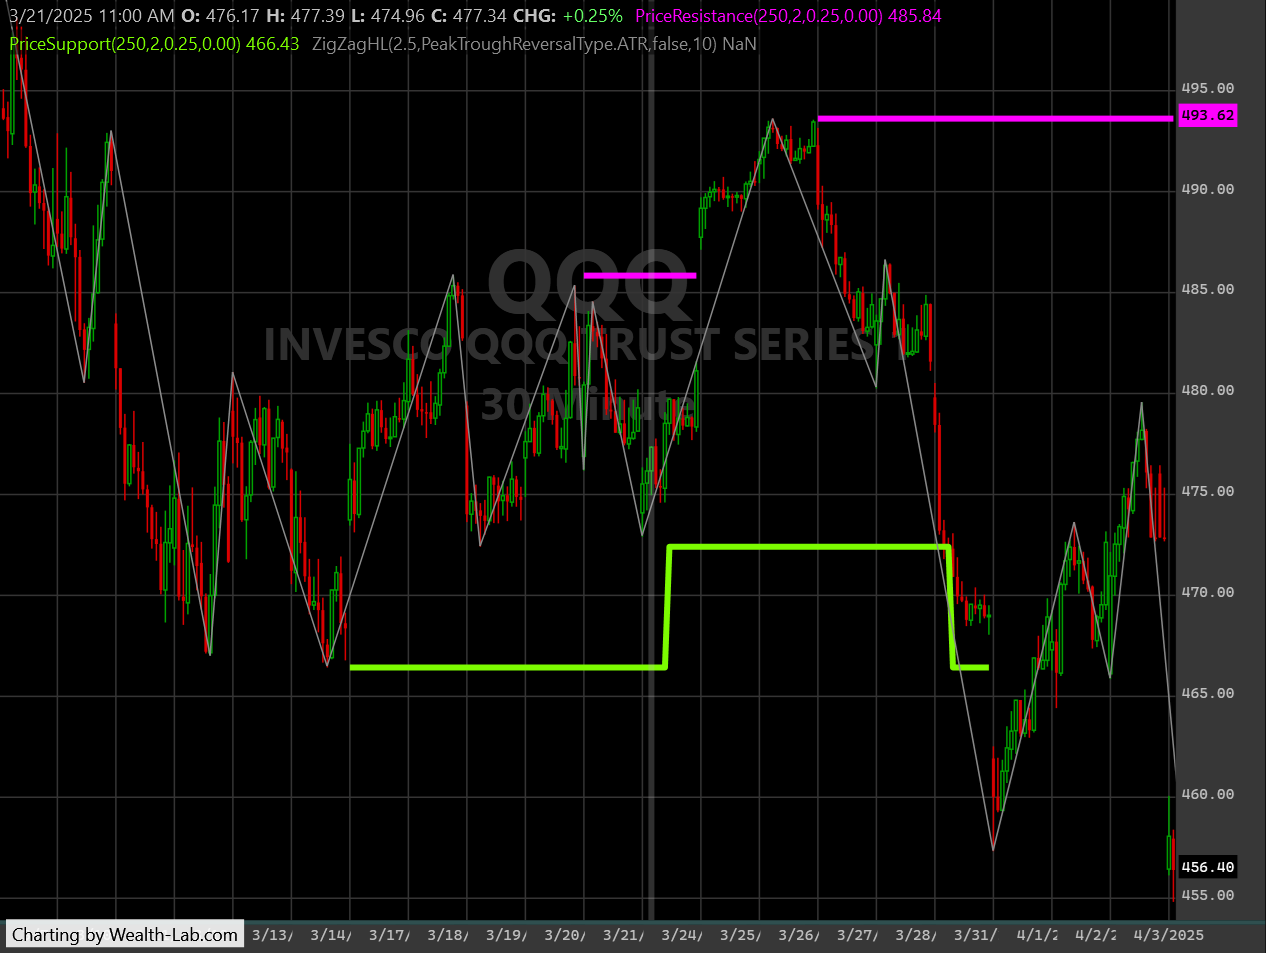
A new block wasn't needed. I came up with these two novel indicators for PowerPack 59 - PriceSupport and PriceResistance. It seems odd that after all these years we don't already have indicators like these... but the devil was in the details.
The indicators identify near-equal troughs/peaks (not required to be consecutive) that price hasn't crossed to be support/resistance. When none are found in the lookback, the indicator returns NaN.
Notice how resistance is crossed on 3/24 and later the next higher level of resistance is identified at 493.62, where the matching peak occurred far earlier on 3/10. (The ZigZag was added as a reference to visualize the peaks and troughs used.)
QUOTE:It is good that they will appear after all. I wrote on this topic a long time ago, but then I started coding myself and it turned out that there are too many details, because it is not always the correct level by peaks/troughs, and it is sometimes very difficult to determine it algorithmically.
I came up with these two novel indicators for PowerPack 59 - PriceSupport and PriceResistance. It seems odd that after all these years we don't already have indicators like these... but the devil was in the details.
QUOTE:I once tried to make Chart Patterns work as I need, and came to the conclusion that in the current implementation it is simply impossible, because it works based on zig zag points. I got that beautiful patterns are not detected on one setting, and if I change it, they start to be detected, but a lot of garbage ones are also detected. I did not come to a balance.
But the way to go for pattern detection is to use the Chart Patterns Extension and add your own patterns to it if required.
I know exactly what you mean. It took me several days to work these out.
I look forward to PowerPack59 and seeing if I can use the Resistance Line Indicator matched up with, for example, a rising 21SMA Indicator to try and create a visual Ascending Triangle back test. Thank you for the additional insight on how the program works.
These resistance/support indicators are based on 2.5 ATR peaks and troughs. Using ATR "auto-adjusts" to the bars for any time scale, and 2.5 ATR seemed to be a good "Goldilocks" number that identifies meaningful peaks/troughs, but not so small to be insignificant. Of course the peaks/troughs can align with much greater moves too.
Your Response
Post
Edit Post
Login is required