I'm interested in the intraday market of the MES future.
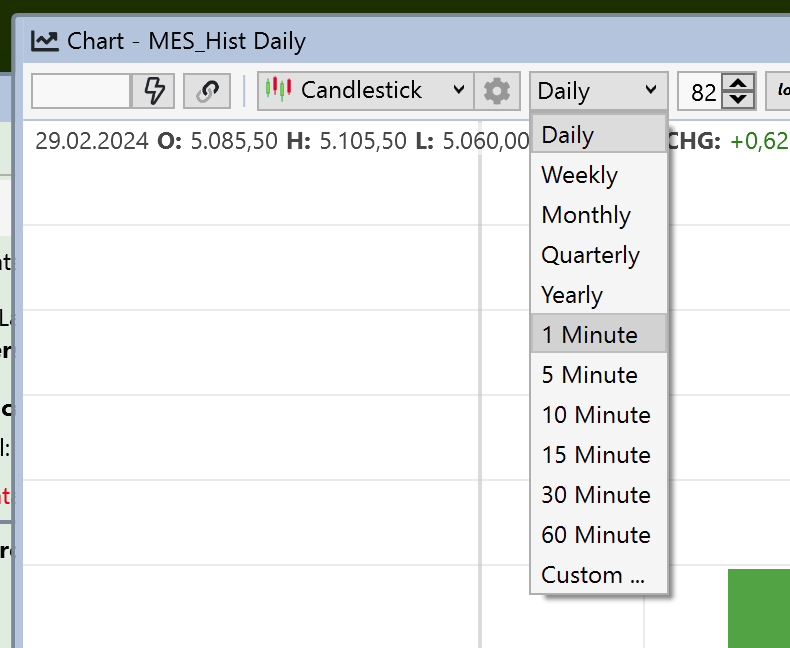
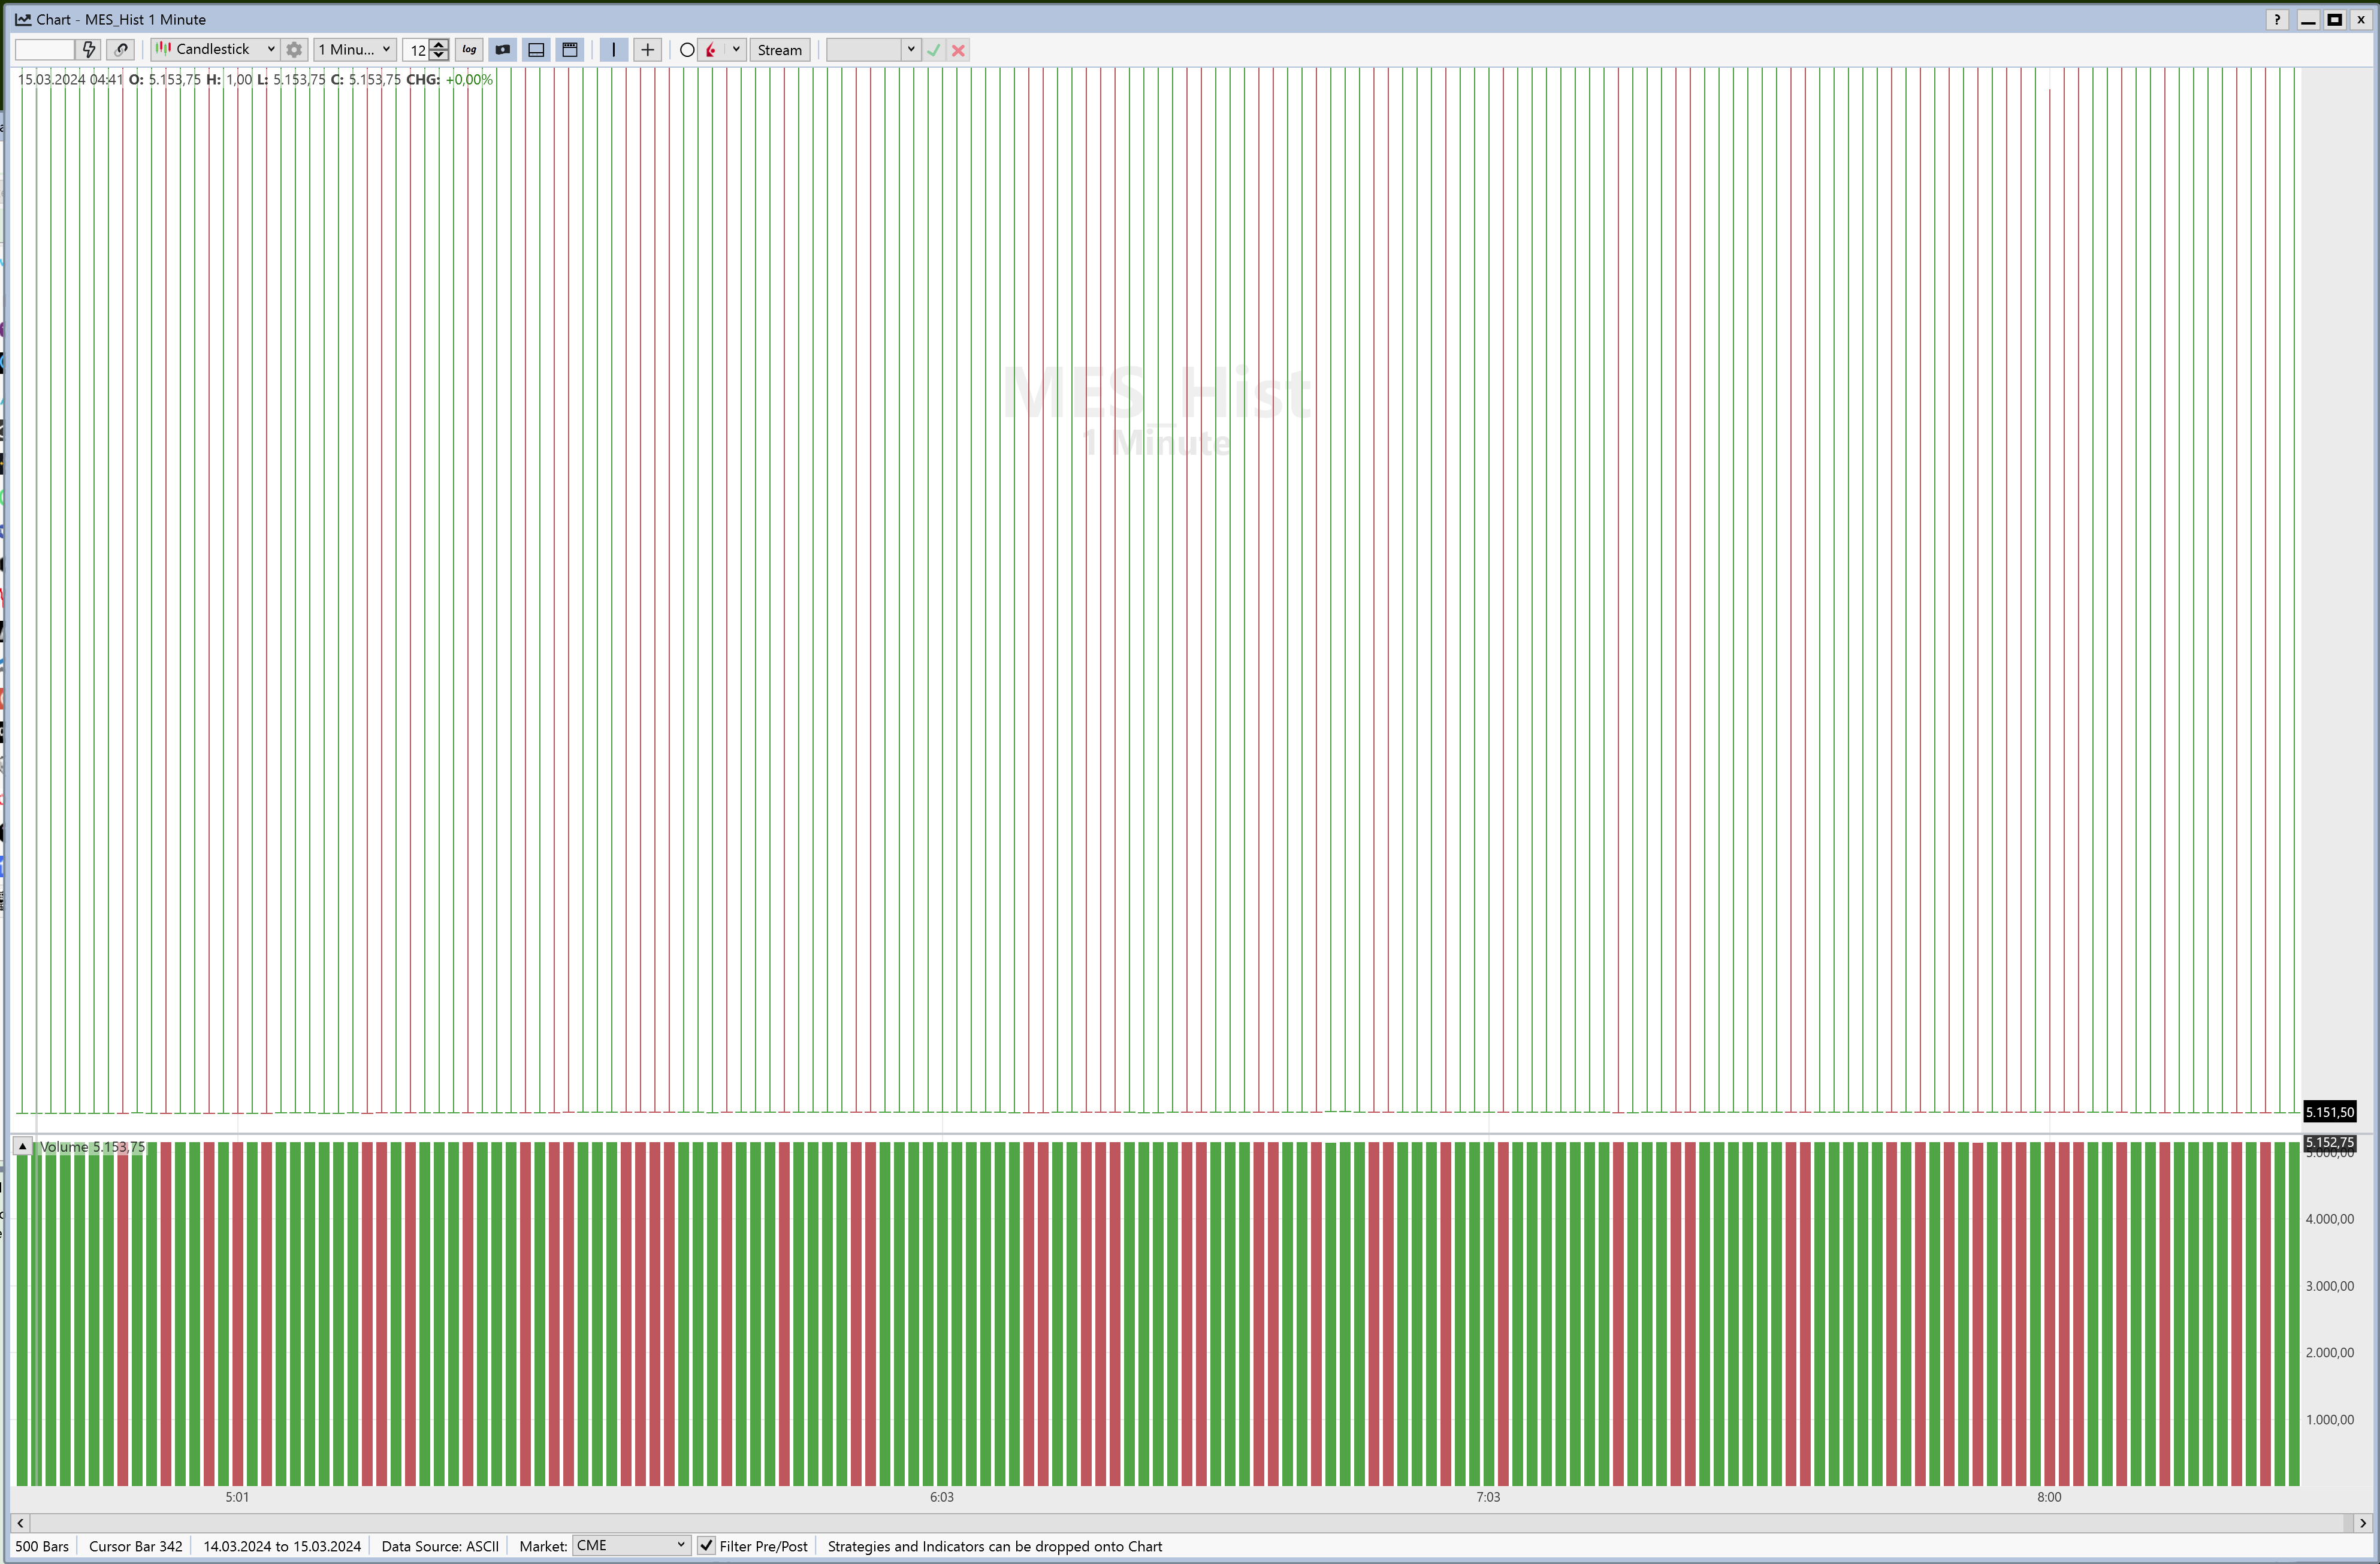
I imported my own 1m-chart data and it looked perfect with daily candles. But if I'm switching to 1m, it looks strange and broken:
Imported data looks like so:
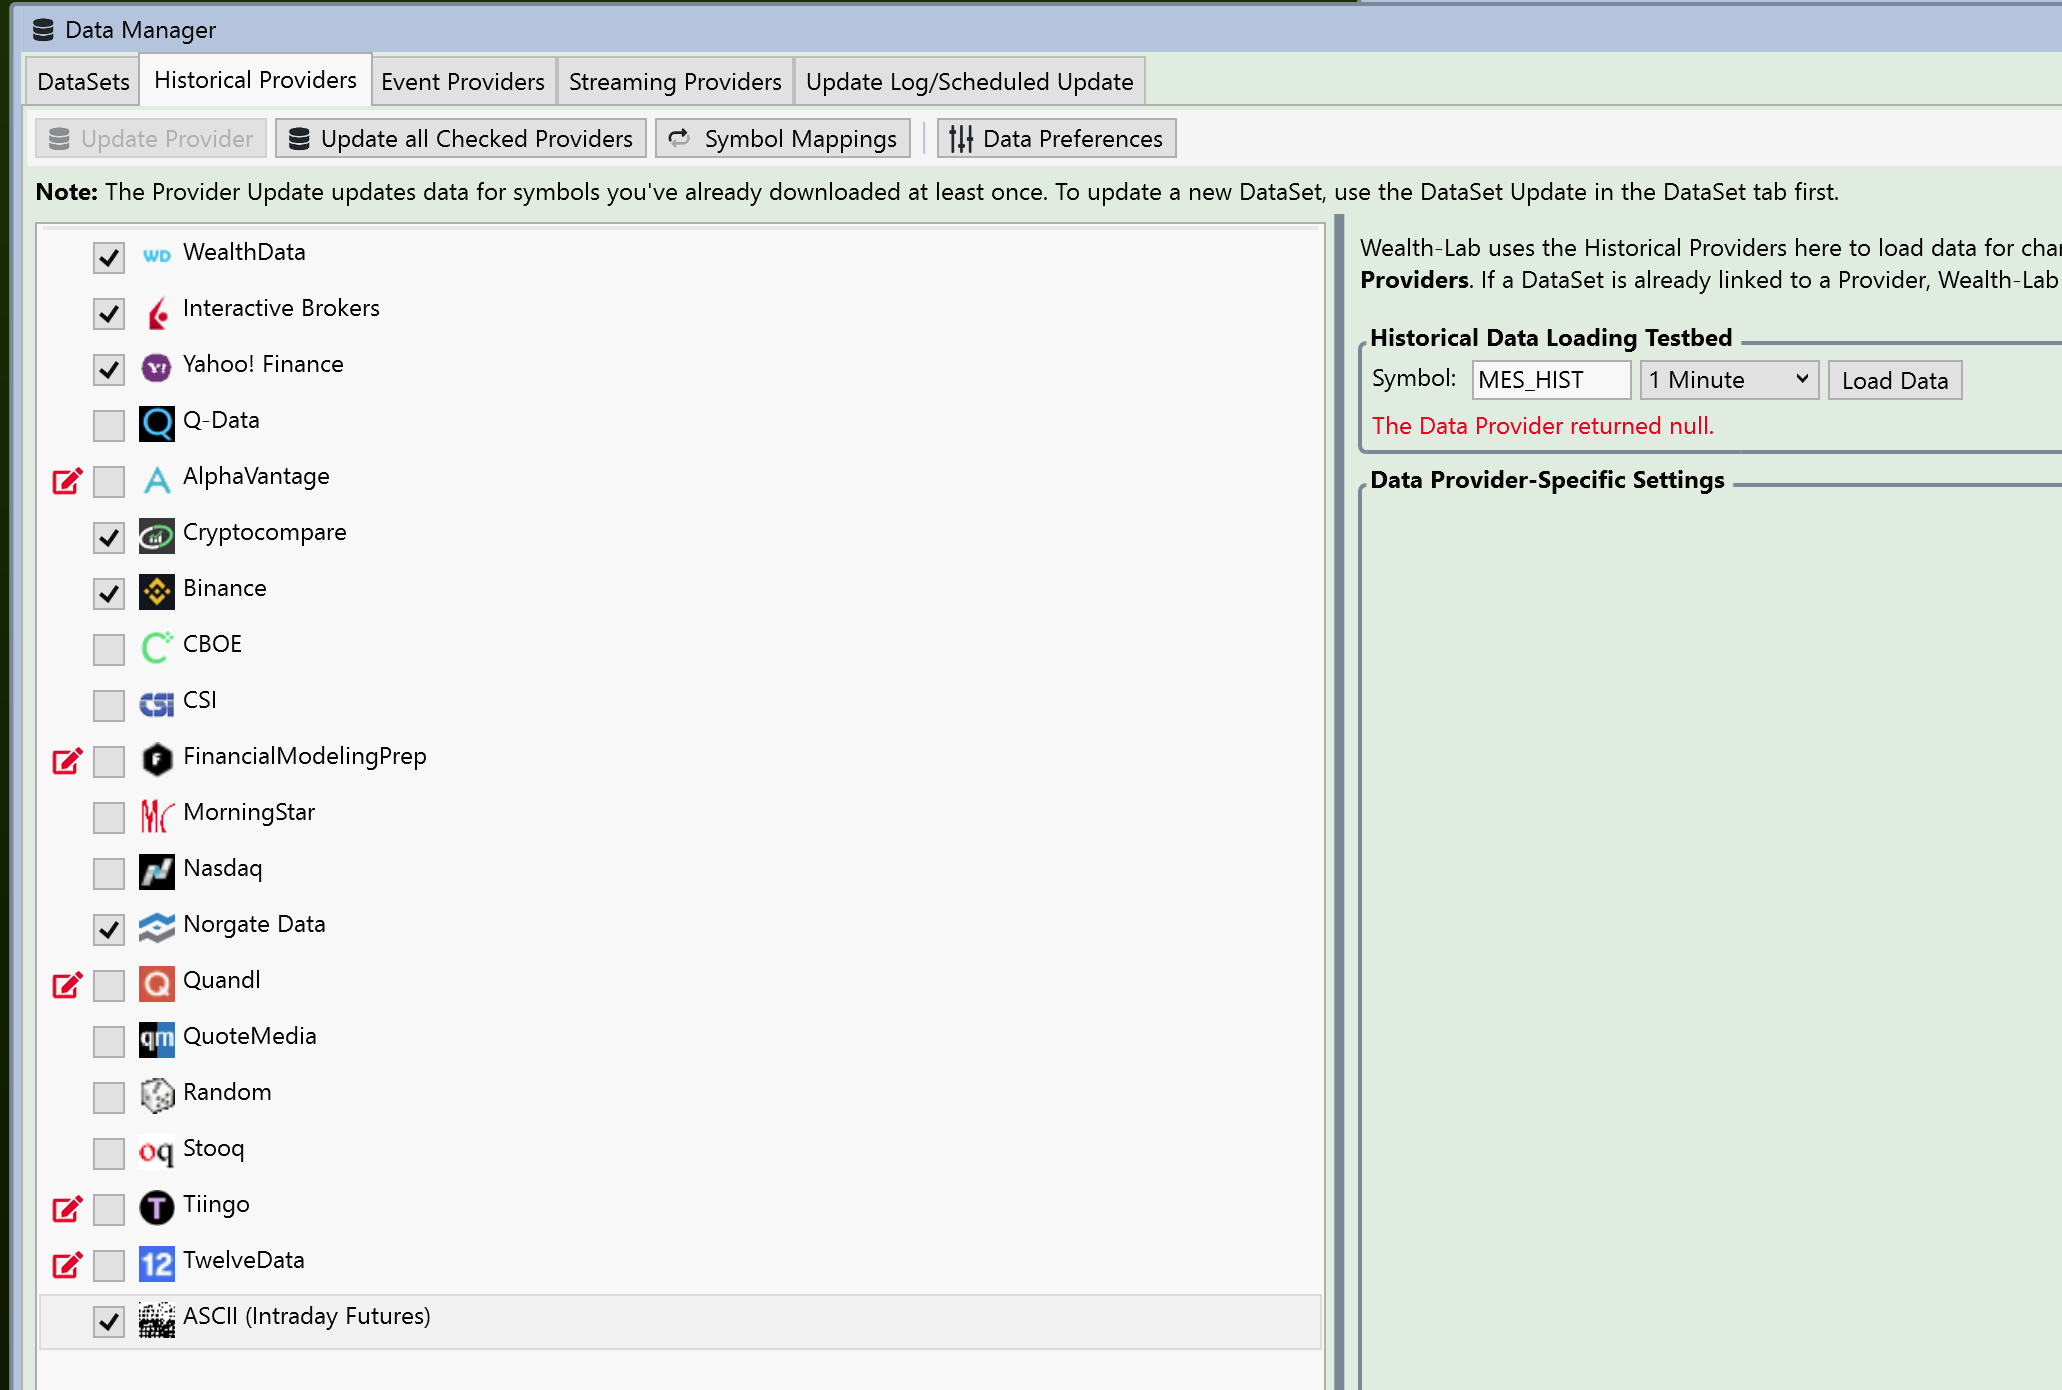
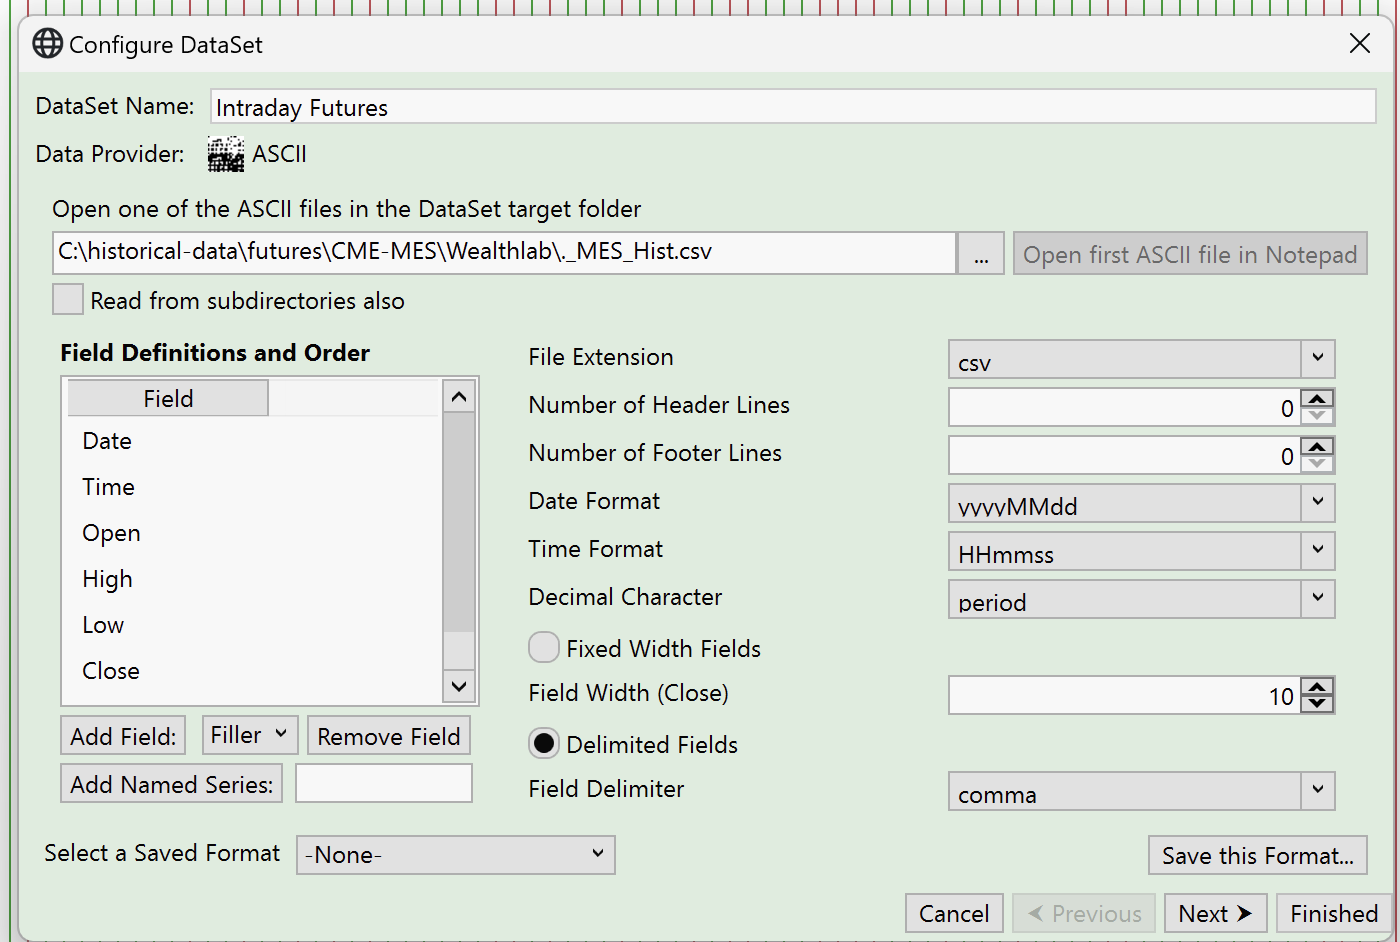
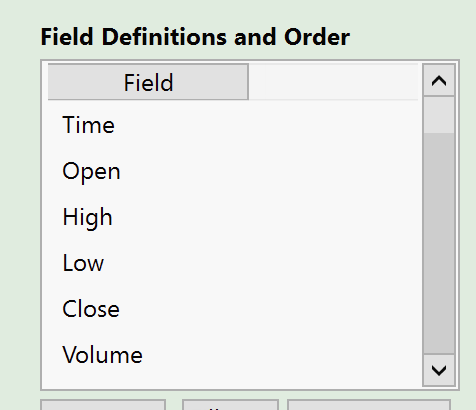
Import settings:
I imported my own 1m-chart data and it looked perfect with daily candles. But if I'm switching to 1m, it looks strange and broken:
Imported data looks like so:
CODE:

20191128,000000,3154.25,3155.5,3153.75,3154.5,312
20191128,000100,3154.5,3154.75,3154.25,3154.25,40
20191128,000200,3154.25,3154.25,3150.75,3152.25,479
20191128,000300,3152.25,3152.25,3151.0,3151.0,221
20191128,000400,3151.0,3151.0,3149.25,3149.75,263
20191128,000500,3149.75,3150.5,3149.5,3150.0,119
20191128,000600,3149.75,3150.25,3149.75,3149.75,148
20191128,000700,3150.0,3150.0,3147.75,3149.25,385
20191128,000800,3149.0,3149.25,3145.25,3145.5,743
20191128,000900,3145.5,3146.5,3144.75,3145.0,399
...
Import settings:
Rename
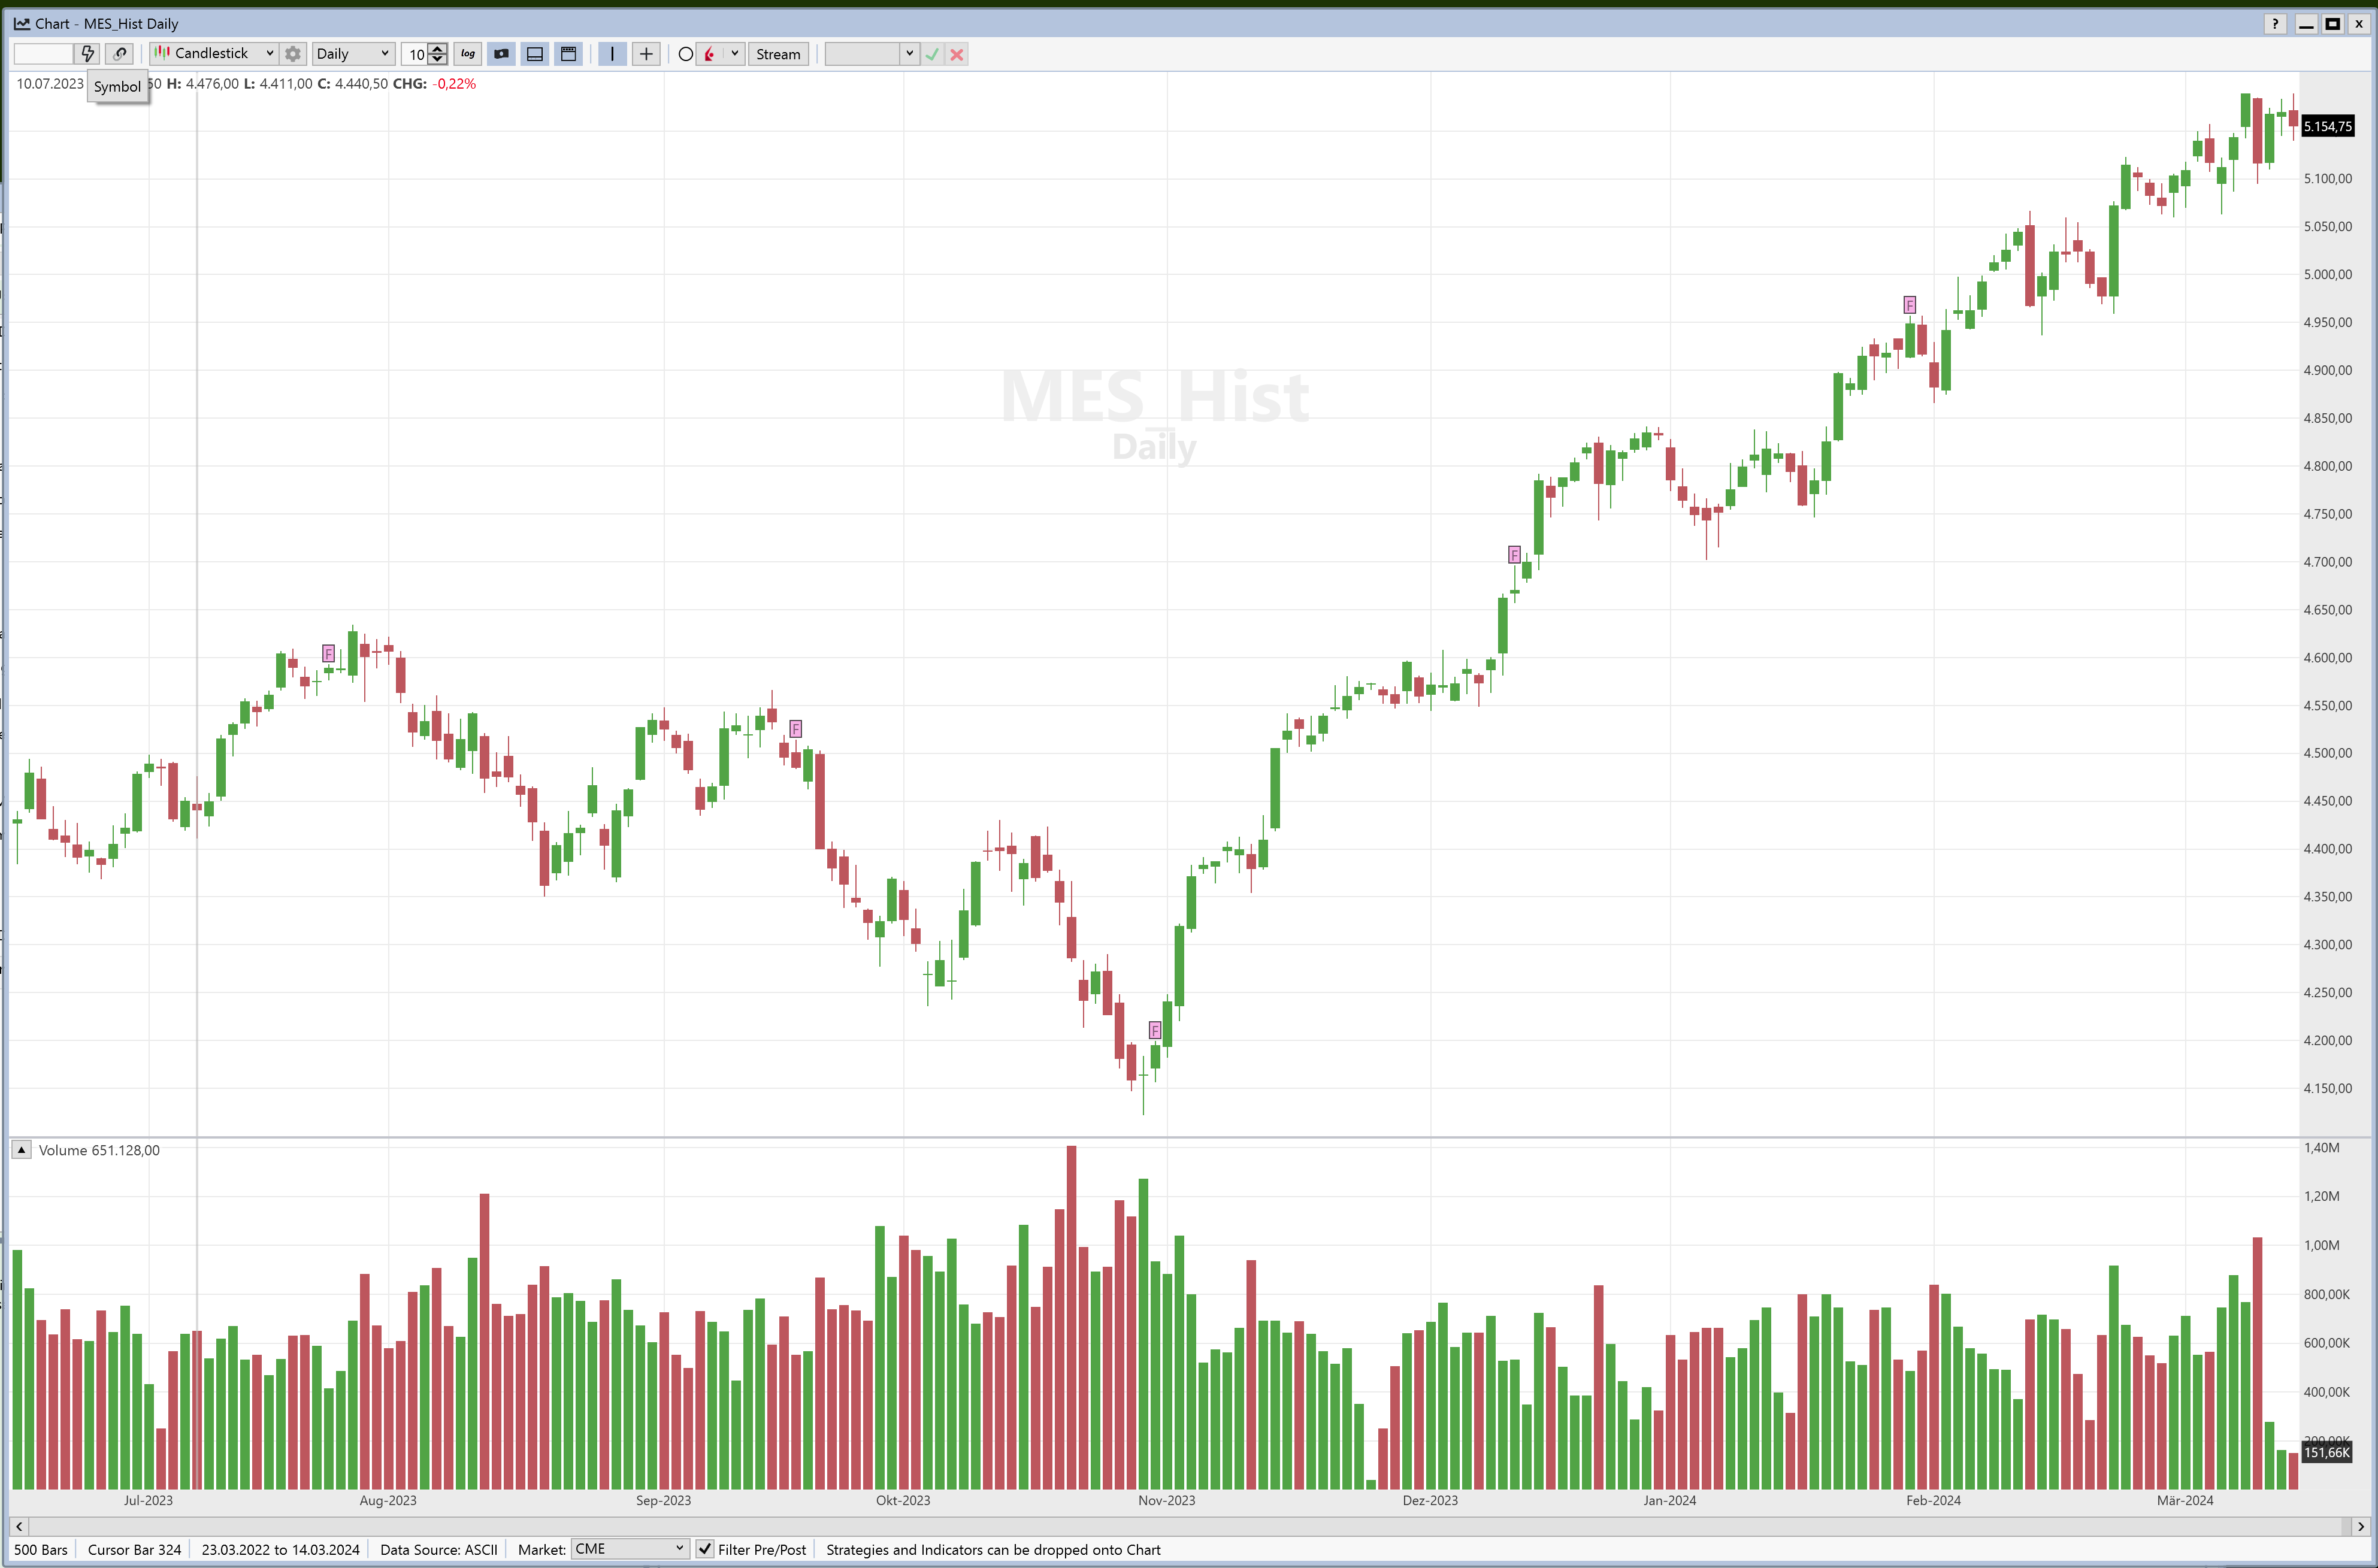
Your "Daily" bars appear to be intraday movements.
There's likely an error in the data, date or time, that caused it to determine the wrong scale. At the end of the wizard, what Scale is shown?
There's likely an error in the data, date or time, that caused it to determine the wrong scale. At the end of the wizard, what Scale is shown?
If you email us the data file we can figure out what is happening.
I got the file and can't find a problem. It works fine for me.
(But read below the images.)
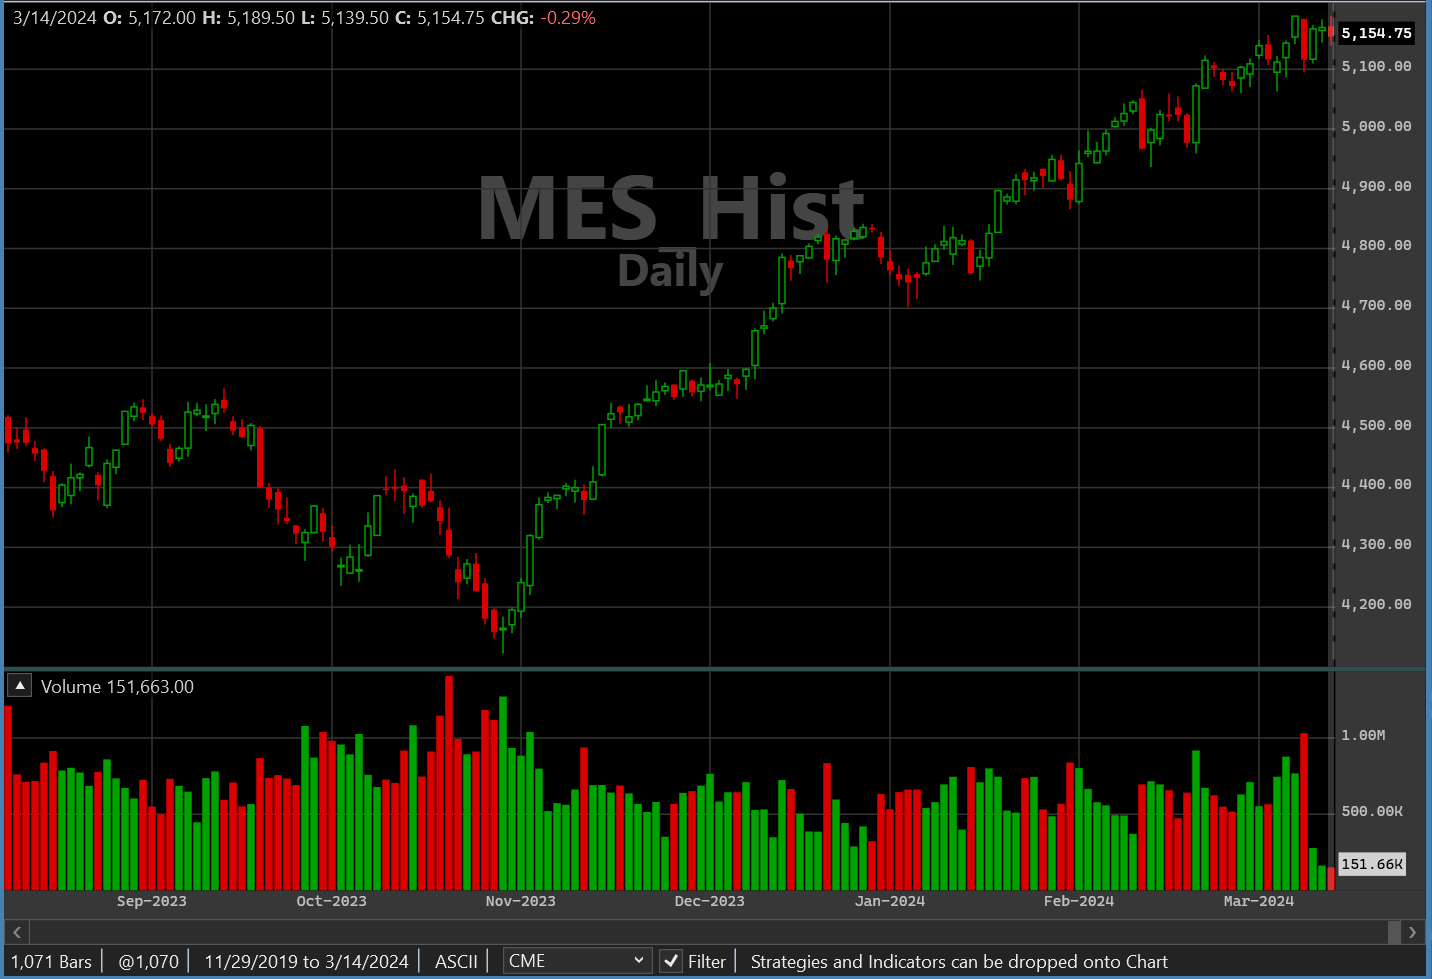
Daily Scale -
1-Minute Bars -
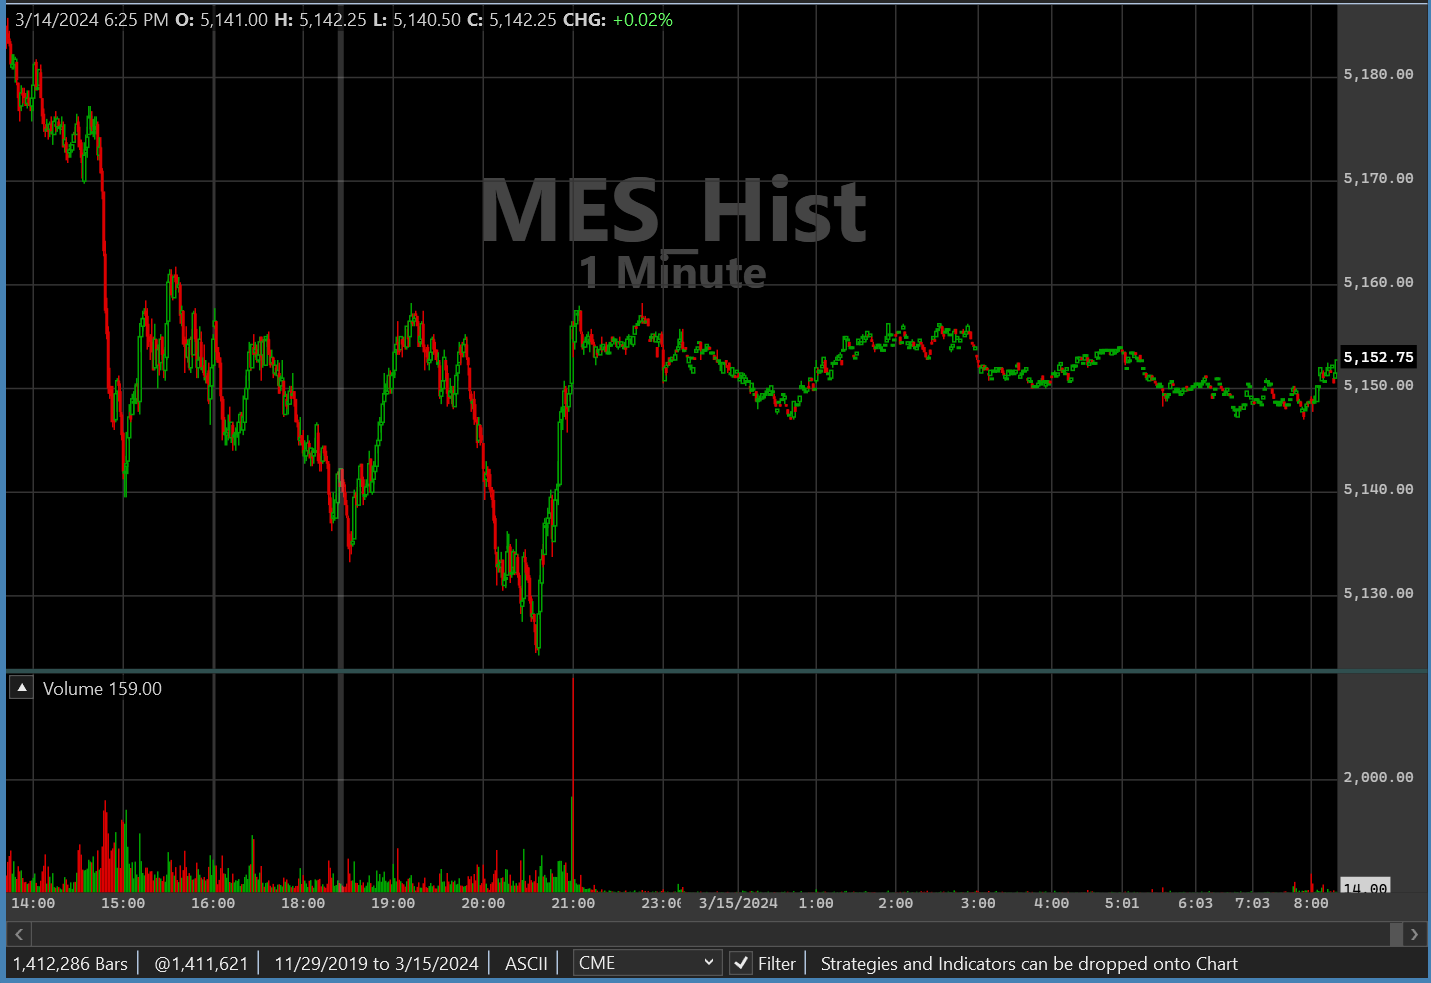
I noticed that in your 1-minute bars image that the volume was actually showing the price level, and, the "High" value in the chart was "1.00" - more like the contract volume.
What may have happened is that the ASCII caching mechanism got confused because you didn't get the ASCII settings correct the first time you tried. If that's the problem, you should be able to fix it by deleting the AsciiCache folder (or just that 1-minute file) from your WealthLab User Data folder.
(But read below the images.)
Daily Scale -
1-Minute Bars -
I noticed that in your 1-minute bars image that the volume was actually showing the price level, and, the "High" value in the chart was "1.00" - more like the contract volume.
What may have happened is that the ASCII caching mechanism got confused because you didn't get the ASCII settings correct the first time you tried. If that's the problem, you should be able to fix it by deleting the AsciiCache folder (or just that 1-minute file) from your WealthLab User Data folder.
Thanks very much. After deleting the cache files it works now.
Your Response
Post
Edit Post
Login is required